ICT Decoded · Killzones and key times of day
What Are ICT Killzones and Key Times of Day?
By Steve H — reads every firm’s official rulebook, checks prices and codes daily, and maintains the Enigma Score · Methodology · Editorial policy · Last updated November 1, 2026
ICT concepts were created and are taught by Michael J. Huddleston, The Inner Circle Trader (X · YouTube). This lesson is FundedEnigma’s own summary, not affiliated with or endorsed by ICT.
In short: ICT killzones (also written kill zones) are set windows of the day, in New York time, when ICT expects the larger moves: Asia 7-9 PM, London 2-5 AM and, for index futures like NQ, New York 8:30-11 AM. Inside them, price often runs the high or low that the earlier hours left behind.
ICT Killzones: When the High or Low of the Day Forms (And When It Doesn't) · 7:00 · published October 31, 2026 · part of the ICT Concepts Decoded playlist
Watch the video
The full video is embedded above this article: ICT Killzones: When the High or Low of the Day Forms (And When It Doesn't). This page is the written version, with every chart walked through step by step. Jump to any part of the video:
- 0:00 Intro
- 0:41 What a killzone is
- 1:10 The three killzones
- 2:02 Key times of day
- 2:37 How to use them
- 3:14 Example 1
- 4:24 Example 2
- 5:24 Not a promise
- 6:08 Recap
Correction, 2026-11-01: the video gives the New York killzone as 7 to 10 AM and, for that window, says about four days in ten. ICT teaches 8:30 to 11 AM for index futures like NQ, so this page uses his window, and with it the count is about one day in three.
Key facts: killzones and key times at a glance
| Term | What it is | Time (New York) |
|---|---|---|
| Asia killzone | The evening window as the new futures day gets going | 19:00-21:00 (7-9 PM) |
| London killzone | Often takes one side of the overnight range | 02:00-05:00 (2-5 AM) |
| New York killzone | Opens with the 8:30 news and covers the 9:30 stock open (ICT's index-futures window) | 08:30-11:00 (8:30-11 AM) |
| Silver Bullet | ICT's one-hour windows inside the New York day, a model of its own | 10:00-11:00 and 14:00-15:00 |
| Noon hour | Usually the quiet hour: smaller ranges, harder to read | 12:00-13:00 |
| Futures day open | The new trading day on CME futures | 18:00 |
| Midnight open | A reference price for the day ahead | 00:00 |
| News and stock open | High-impact reports, then the stock market open | 08:30 and 09:30 |
Last verified 2026-11-01. All charts below are real historical CME NQ futures data, shown in New York time.
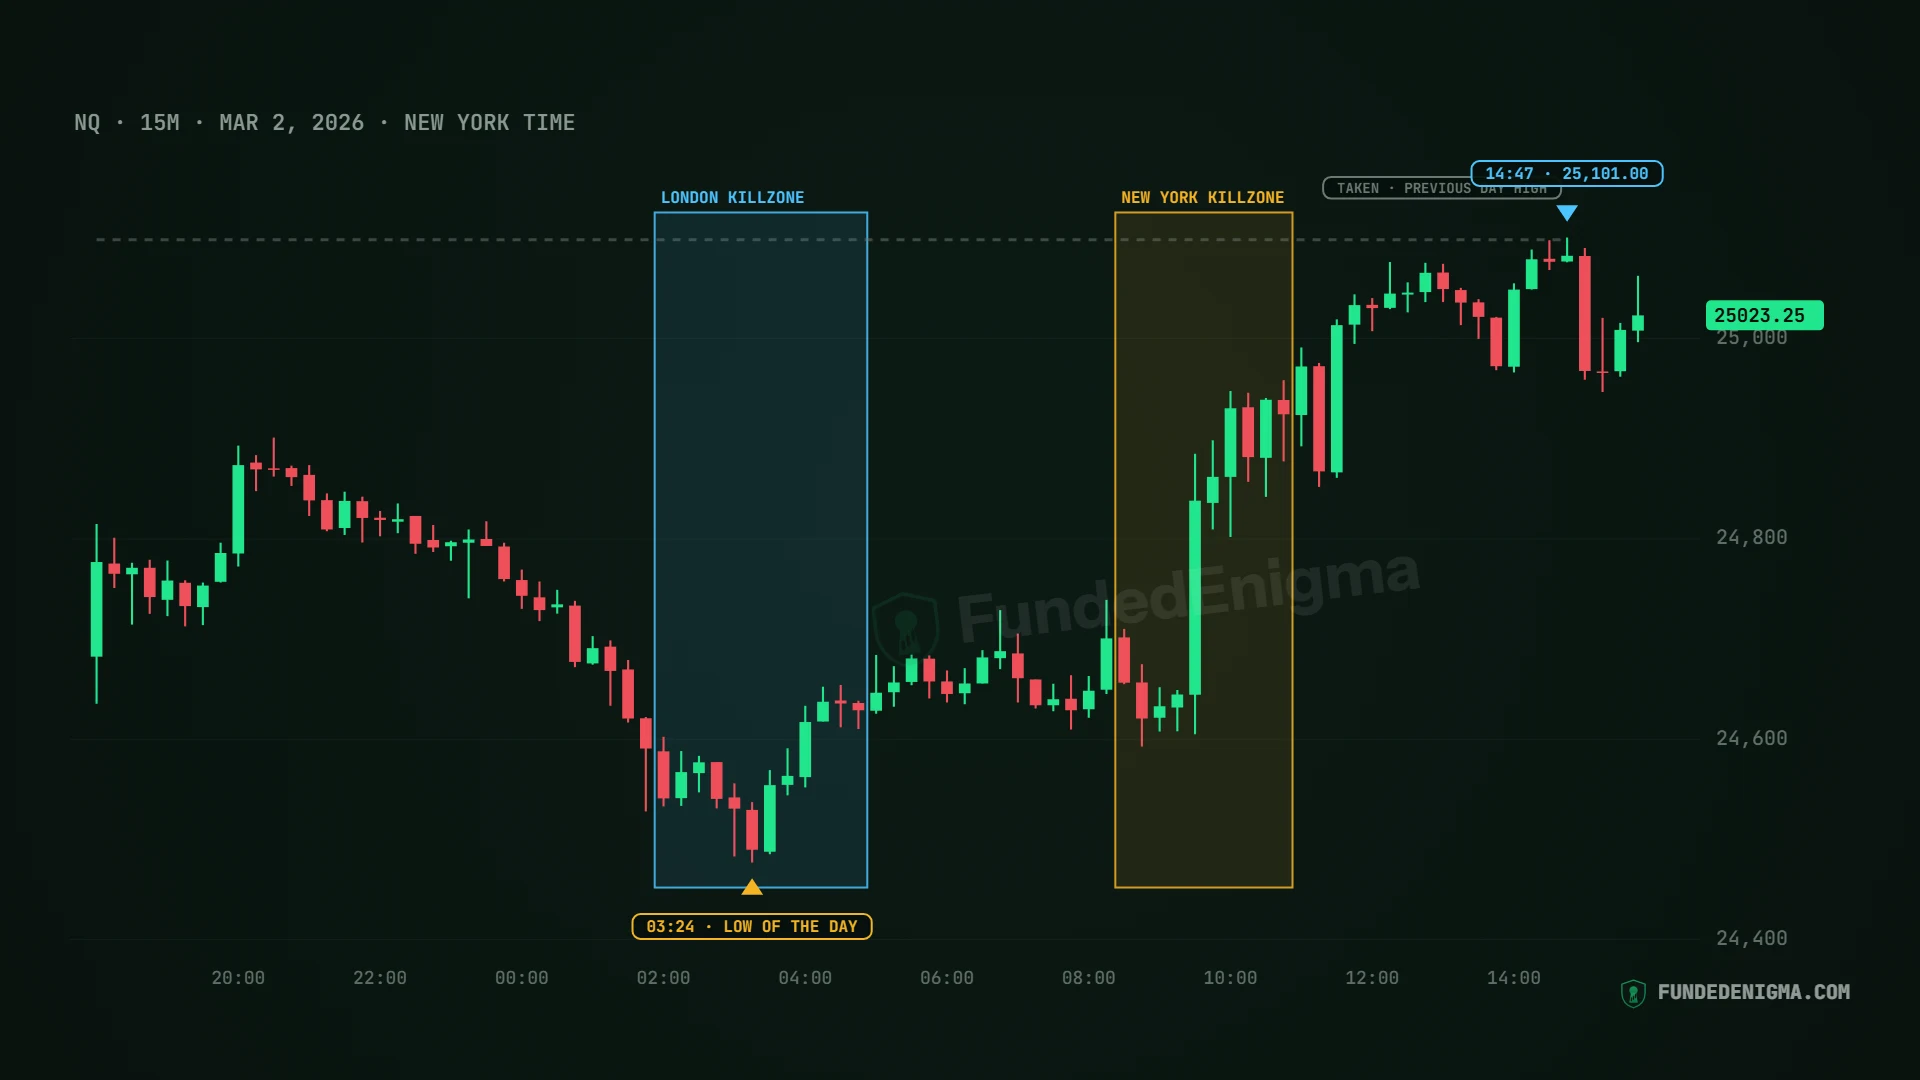
Here is the idea on one chart. On March 2, 2026, NQ printed its low of the day at 3:24 in the morning, New York time, inside the London killzone. The New York killzone then lifted price away from that low, and at 2:47 in the afternoon it traded just above the previous day's high.
What is a killzone in trading?
A killzone is a window of the day, set in New York time, when ICT expects the bigger moves. It lines up with the hours when a major market opens and volume arrives. Inside those windows, price often runs the high or the low that the earlier hours left behind, and that run can set the high or the low of the day.
Every time on this page is New York time. Set your chart clock to New York, so daylight saving changes never move your windows.
What are the ICT killzone times?
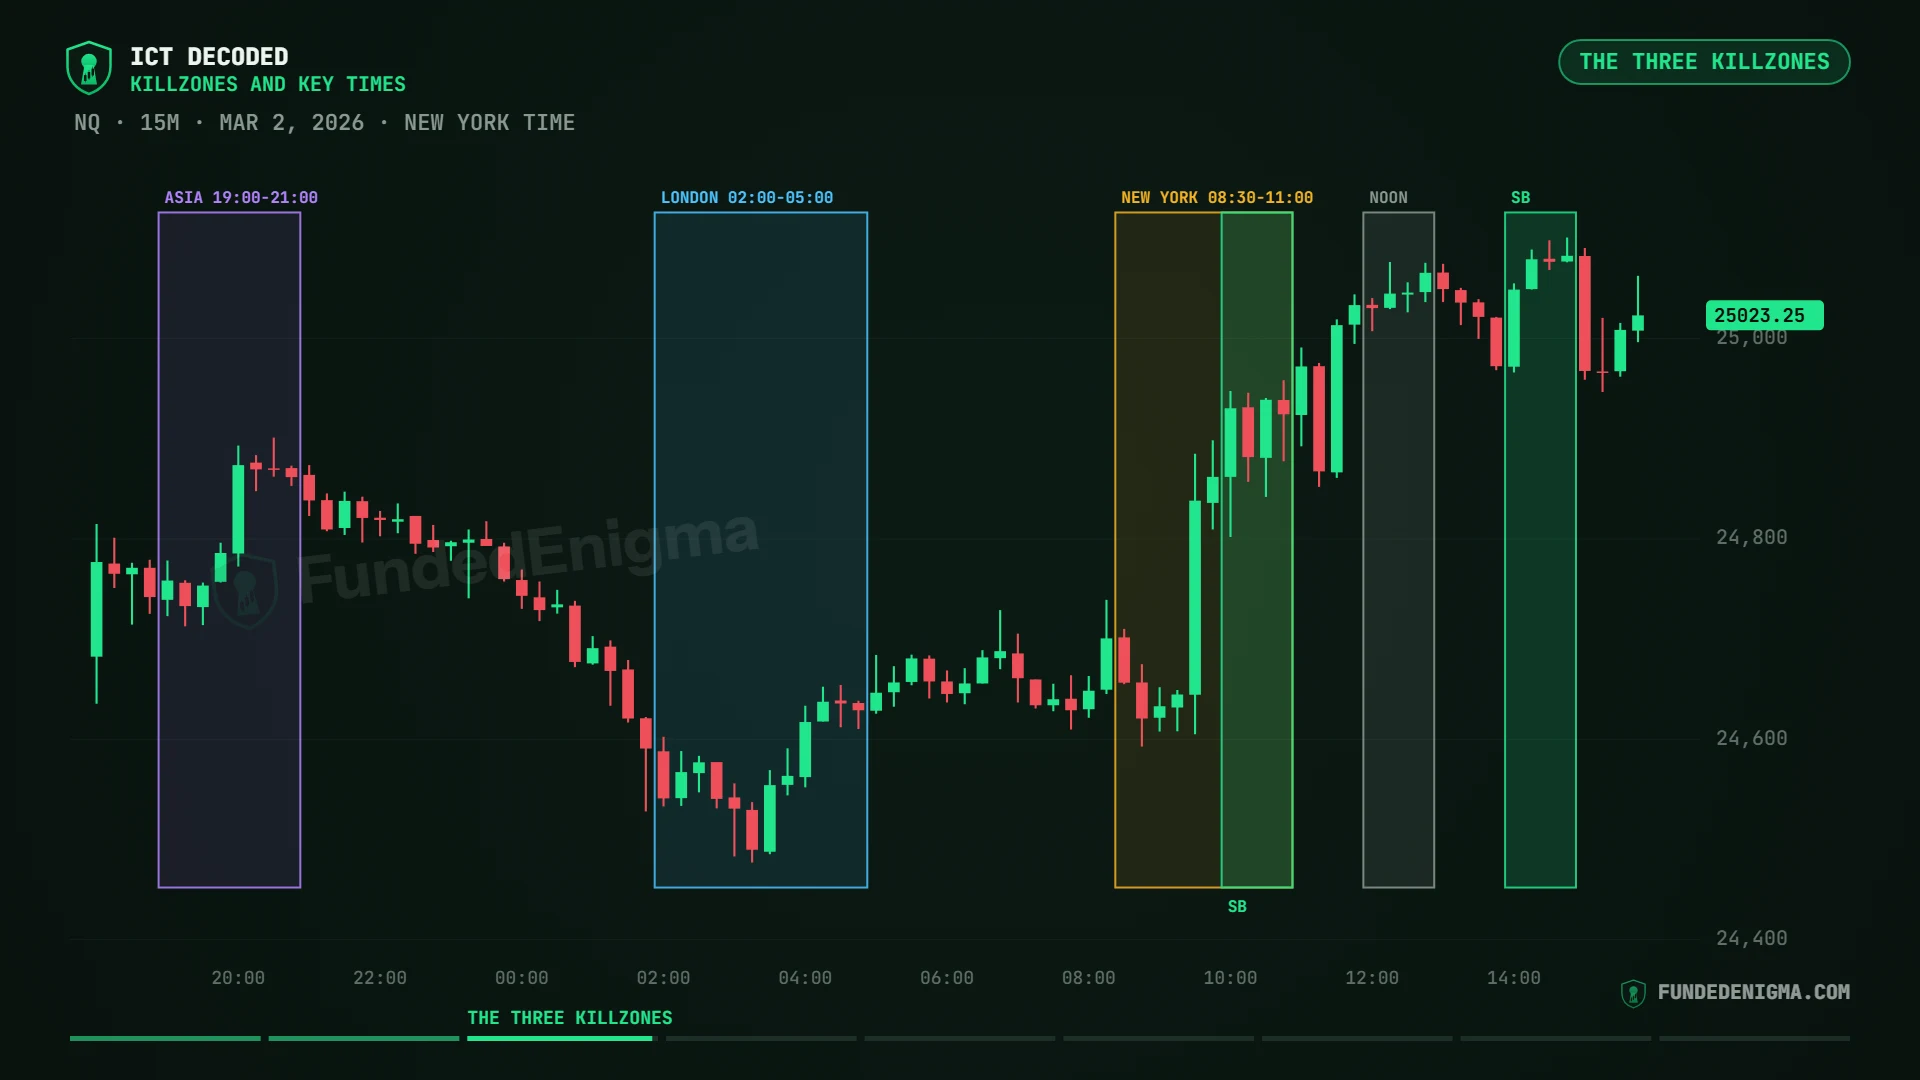
Asia 7-9 PM, London 2-5 AM and New York 8:30-11 AM, all New York time. These are the windows ICT teaches; the New York one is his window for index futures like NQ.
Asia killzone time
The Asia killzone runs from 7 to 9 PM New York time, as the new futures day gets going.
London killzone time
The London killzone runs from 2 to 5 AM New York time. London often takes out one side of the overnight range, and on some days that is where the high or the low of the day is made.
New York killzone time
For index futures like NQ, ICT teaches the New York killzone as 8:30 to 11 AM New York time. It opens with the 8:30 news and covers the 9:30 stock market open, so it is often the most active window of the day. For forex, ICT teaches an earlier New York window, 7 to 9 AM.
Inside the New York day, ICT also narrows things down to one-hour windows called the Silver Bullet: 10 to 11 AM and 2 to 3 PM. That is a model of its own, so this page only names it. The noon hour, 12 to 1 PM, is usually the quiet one.
What are the ICT key times of day?
Key times are single opening prices you mark on the chart: 6 PM (the new futures day), midnight (the midnight open), 8:30 (the big economic reports), 9:30 (the stock market open) and 4 PM (the stock session close).
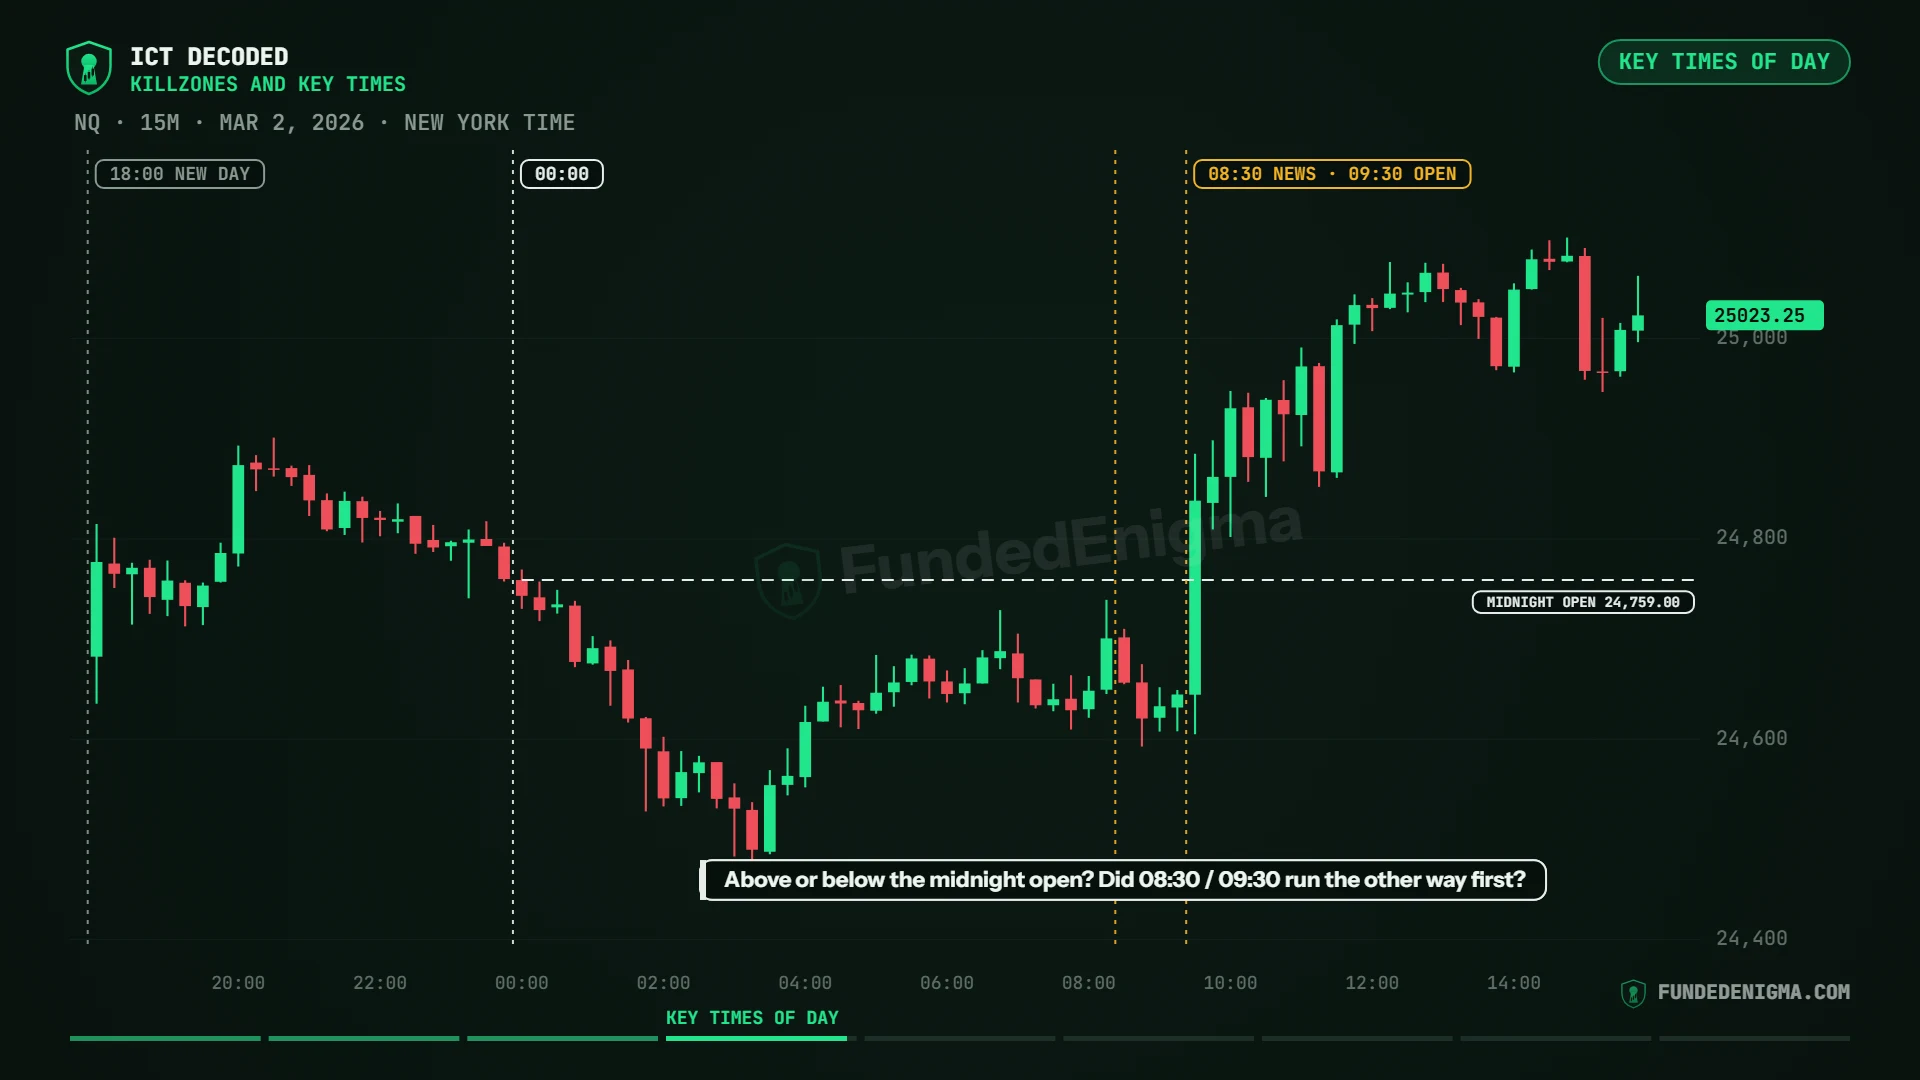
ICT uses these opening prices as references. Is price above or below the midnight open? Did the 8:30 or 9:30 move run against the day's direction first, then turn?
How do you use killzones?
Mark the earlier highs and lows before the window opens, watch which one gets run inside it, then read what comes after the run with the rest of the toolkit.
- Before the window. Mark the highs and lows the earlier hours left. For London, that is the Asia range. For New York, it is the London high and low. See liquidity.
- Inside the window. Watch which of those levels gets run. A run of a level inside the window is the event. Time alone is not.
- After the run. Read it with the draw on liquidity, a market structure shift and a fair value gap. The killzone tells you when to pay attention, not which way to go.
What do killzones look like on real charts?
One day where the London killzone made the low of the day and New York delivered the move away from it, and one where the New York killzone made the high of the day, both on the 15-minute chart.
Example 1: the London killzone low, NQ 15-minute, March 2, 2026
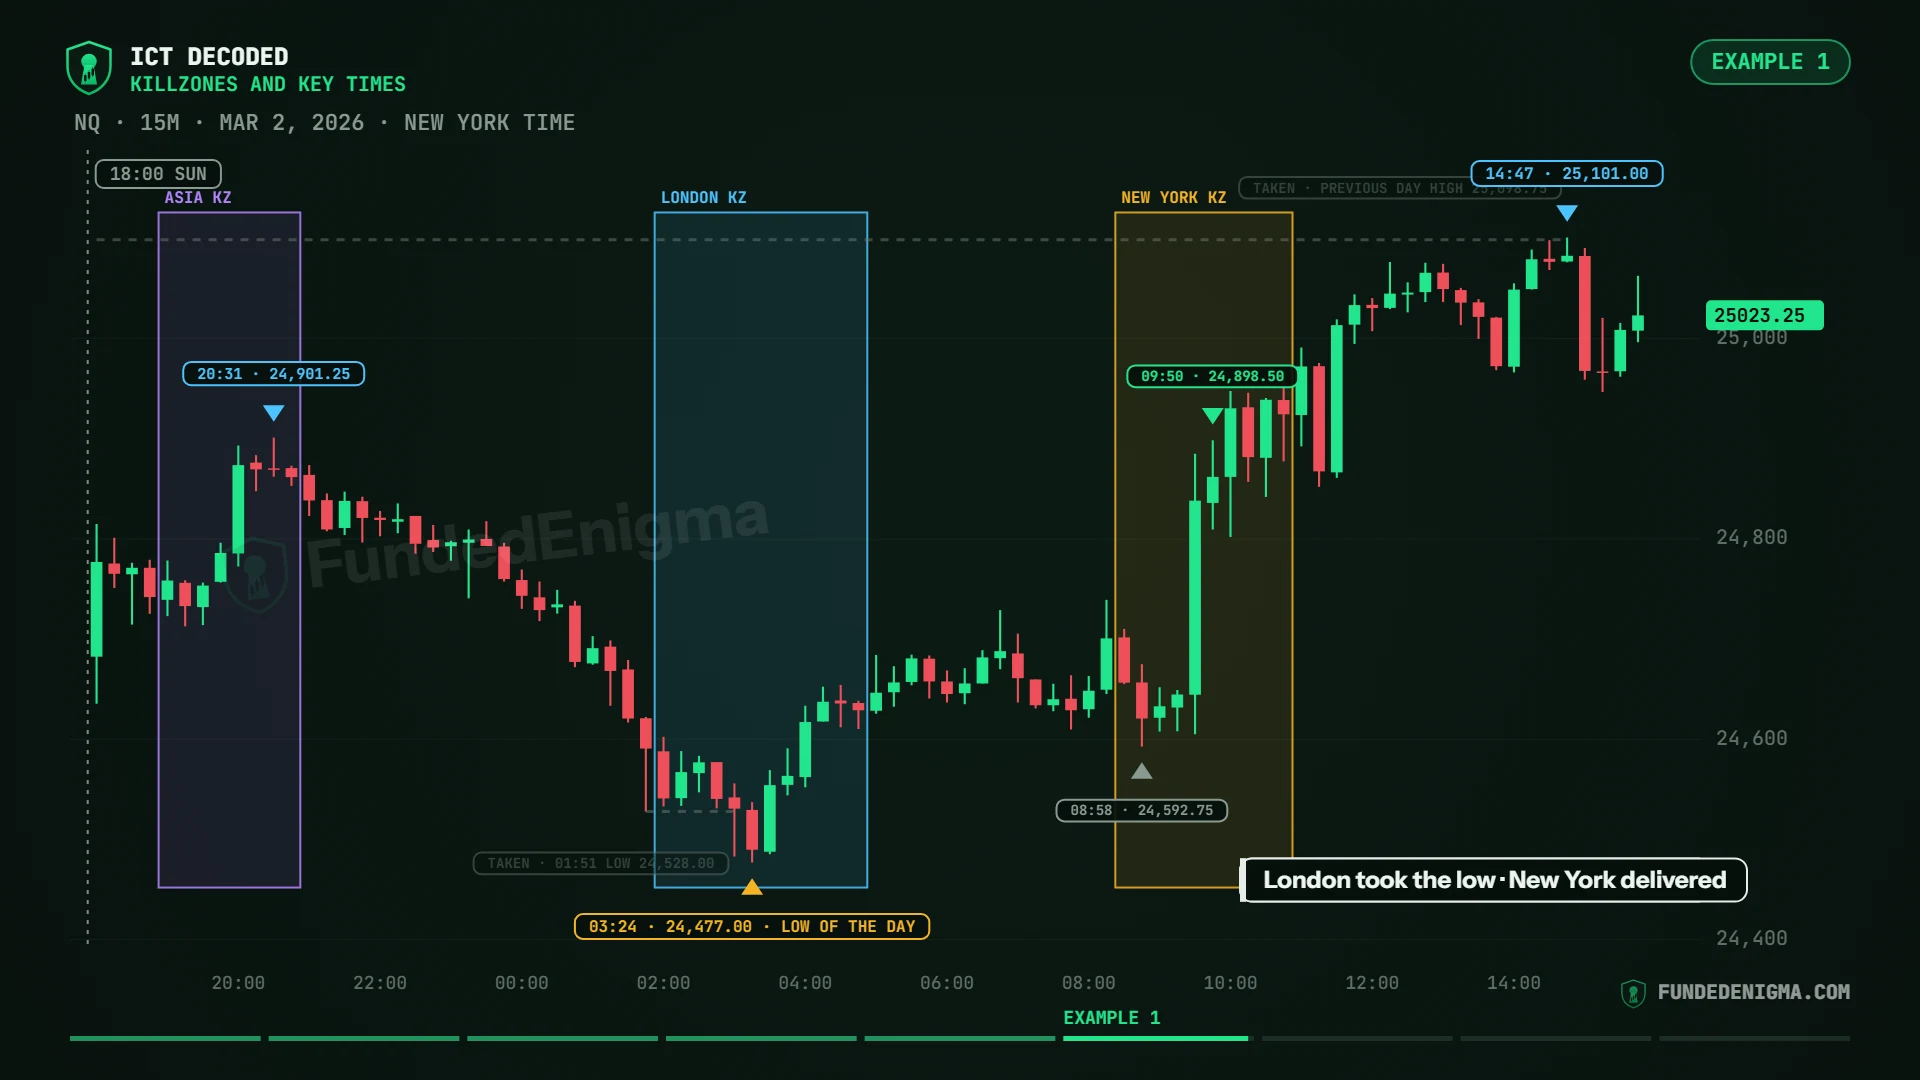
- The futures day opens at 6 PM on Sunday. In the Asia killzone, at 8:31 PM, price makes a high at 24,901.25.
- Price drifts lower, to a low of 24,528.00 at 1:51 AM.
- The London killzone opens at 2 AM. At 3:00 price trades below that 1:51 low, and at 3:24 it reaches 24,477.00. That is the low of the day.
- In the New York killzone the pullback holds above it, with a low of 24,592.75 at 8:58. After the 9:30 open, price reaches 24,898.50 by 9:50.
- The previous day's high is at 25,098.75. At 2:47 PM price trades just above it, to 25,101.00, the high of the day.
Example 2: the New York killzone high, NQ 15-minute, February 12, 2026
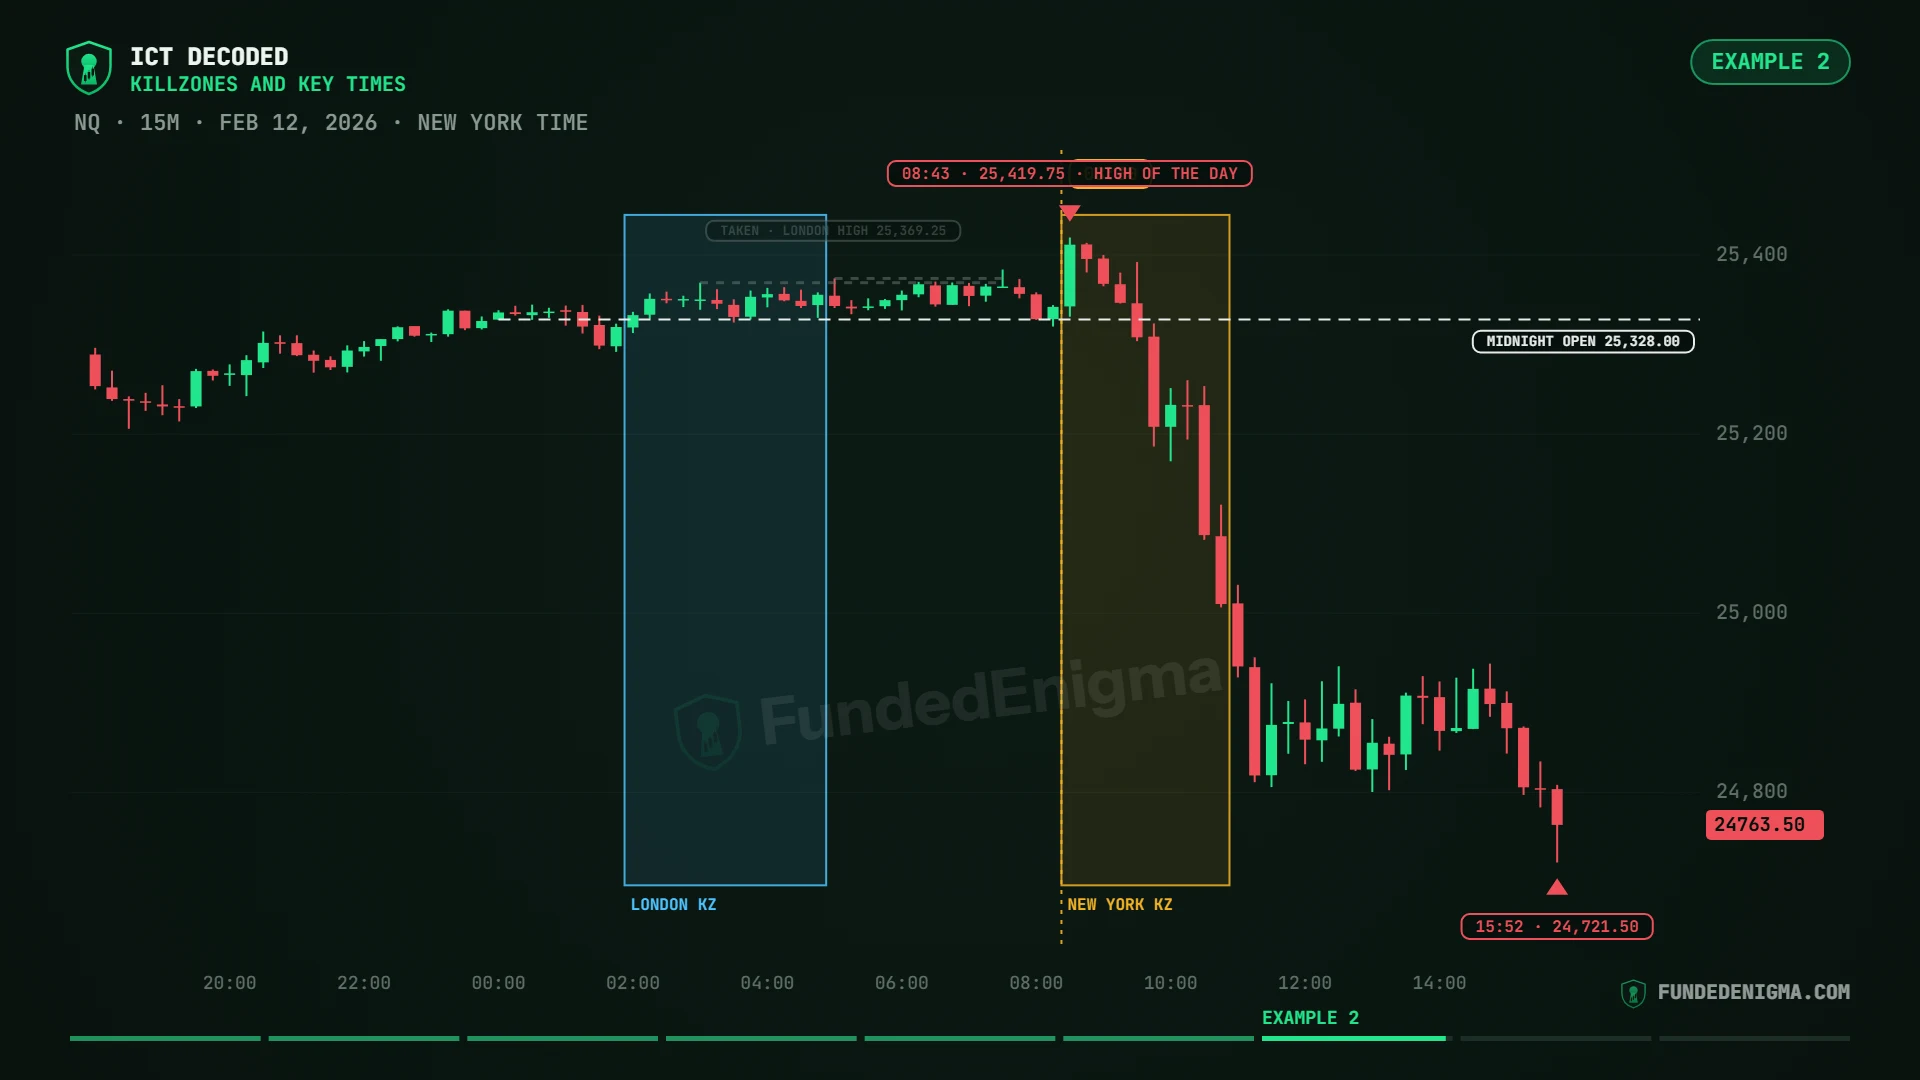
- The London killzone makes a high at 25,369.25 at 3:09 AM. Just after London, at 5:04, price edges a little higher, to 25,374.00.
- At 7:31, before the New York killzone opens, price already trades above both of those highs.
- The New York killzone opens at 8:30, and price runs up to 25,419.75 at 8:43. That is the high of the day, made inside the New York killzone.
- The midnight open is at 25,328.00. At the 9:30 open price trades back below it, and after 10:00 it does not get back above it that session.
- At 3:52 PM price reaches 24,721.50, about 700 points below the morning high.
Do killzones work every day?
No. We checked 577 NQ sessions, from June 2024 to September 2026: on about one day in three, neither the high nor the low of the day formed inside any of the three killzones, and on more than nine days in ten at least one of them formed outside.
So a killzone is not a clock that makes the high or the low. It is a window where a run of a level is worth more attention. Many highs and lows come later in the day. Time is ICT's framework for when to look, not a promise.
Killzone vs session: what is the difference?
The Asia high and low in our liquidity lessons come from the Asia session, 8 PM to midnight New York time. The Asia killzone, 7 to 9 PM, is only the window ICT watches inside the evening. Keep the two apart when you mark your chart.
How do you use killzones in your own charting?
Use time as a filter: it tells you when to look, and the level, the shift and the draw tell you what it means.
- Say the window. Name the killzone and the New York time whenever you describe a move.
- Say which level was run. The Asia range in London, the London high or low in New York.
- Use the opens as references. Above or below the midnight open; what the 8:30 and 9:30 moves did first.
- Expect days that do not fit. Plenty of highs and lows form outside the windows.
More concepts in the series are on the ICT Concepts Decoded hub. If you trade futures with a prop firm, you can look up a firm's rules on the challenges page or set two firms side by side on the compare page.
Frequently asked questions
Are ICT killzones in EST or New York time?
New York time, which is EST in winter and EDT in summer. Set your chart to New York and the windows stay on the same clock all year.
What is the best killzone to trade?
This page does not pick one for you. The New York killzone covers the 8:30 news and the 9:30 open, so it is often the most active window.
What is the midnight open in ICT?
The opening price at midnight New York time. ICT uses it as a reference for the day: is price above or below it?
Is the Silver Bullet a killzone?
It is ICT's narrower one-hour window inside the New York day, 10 to 11 AM and 2 to 3 PM, and a model of its own. ICT also teaches a London open Silver Bullet, 3 to 4 AM.
Do killzones work on forex and crypto too?
The windows are clock times, so they can be drawn on any chart, though ICT gives forex a different New York window, 7 to 9 AM. The examples on this page are NQ futures only.
What should I do outside the killzones?
Keep marking the levels. A killzone is a filter, and the high or low of the day often forms outside the windows.
Sources
- Concept: killzones and the key times of day as taught by ICT (The Inner Circle Trader, Michael J. Huddleston), who originated these terms. The explanation, examples and charts on this page are our own; the windows are the ones ICT teaches, with New York given as his index-futures window.
- Data: every chart and the 577-session count are real historical CME Nasdaq-100 E-mini (NQ) futures data, shown in New York time.
- Video: ICT Killzones: When the High or Low of the Day Forms (And When It Doesn't), FundedEnigma.
Last verified: 2026-11-01. Written by Steve H.
Disclaimer: This page is for education only and is not financial advice. Trading futures involves substantial risk of loss. Past price behaviour does not guarantee future results.
Related ICT concepts
- Reading Candles: Open, High, Low, Close and Wicks: How to read a candle the ICT way: open, high, low, close, the order they print in, expansion, reversal and indecision candles, and the wick's 50%, on three real NQ sessions and 4,195 sessions of data.
- Dealing Ranges and Average Daily Range (ADR): What an ICT dealing range is, how to measure average daily range (ADR), and what 4,175 NQ sessions and 473 New York mornings say about each, on three real NQ charts.
- Phases of Price: Consolidation, Expansion, Retracement, Reversal: The four ICT phases of price (consolidation, expansion, retracement, reversal) with a testable rule for each, two real NQ sessions and what 527 days of 15-minute data say about each phase.
- Top-Down Analysis: From the Daily Bias to the Five-Minute Chart: ICT top-down analysis with one job per timeframe (daily bias, one-hour structure, five-minute timing), two real NQ sessions and what 1,264 five-minute shifts say about lining the timeframes up.
- The A+ Entry Checklist: ICT's Setup in Order: ICT's A+ entry checklist as seven checkable boxes, two real NQ sessions and what 1,919 five-minute setups say about ticking more of them.
- The Silver Bullet: ICT's One-Hour Window: ICT's Silver Bullet defined so it can be checked, two real NQ mornings and what 1,534 days say about whether the 10 to 11 AM hour matters.
- Breaker + FVG (the Unicorn) and the Box Setup: ICT's breaker + FVG pairing and the box setup, defined so they can be checked, four real NQ mornings and what 2020-2026 NQ data says about each.
- ICT's Son's Model and the Twitter Model: ICT's son's model and the Twitter model, defined so they can be checked, four real NQ mornings and what 2020-2026 NQ data says about each.
- Broadening Formations: ICT broadening formations defined so they can be checked: 15-minute, daily and session versions on real NQ charts, and what 2020-2026 NQ data says.
- Trading Without a Structure Break: Reading a raid before the market structure shift, defined so it can be checked: three real NQ mornings and what 2020-2026 NQ data says about the early read versus waiting for the shift.
- Stops, Sizing and Trailing for Prop Accounts: Stops placed where the idea is wrong, sizing by a fixed risk, and what tighter stops, trailing and losing runs looked like on 2020-2026 NQ data, for a prop account's drawdown limit.
- News and the Economic Calendar: Filtering the economic calendar, ICT's idea of news as the catalyst, three real NQ release days and what CPI, jobs-report and Fed days did on 2020-2026 NQ data.
- Why Traders Fail with ICT (and the Fix): Why traders struggle with ICT: the busy chart tested on 2020-2026 NQ, boxes drawn for no reason, losing streaks in one fixed rule, and how to make your trading measurable.
- Currency Futures and the Dollar Index (6E, 6B, DXY): 6E, 6B and the dollar index explained, why a forex pair is a fraction, and whether picking the pair from yesterday's daily candle worked on 2010-2026 daily data.
- EURGBP for Relative Strength (EURUSD vs GBPUSD): EURGBP as a live gauge of relative strength between EURUSD and GBPUSD, two real New York mornings, and a test of whether it tells you in advance.
- Internal vs External Liquidity: Where pullbacks stop and where the next leg goes: the back and forth between old highs and lows and fair value gaps.
- Market Structure: Read the trend from swing highs and lows, and tell a real change in trend from a pullback.
- Protected and Relevant Swings: Rank swing highs and lows, see how a swing becomes protected, and focus on the relevant ones.
- Market Structure Shift: Spot the turn: a stop raid, then displacement through the swing that started the last push.
- MSS vs Liquidity Grab: The wick shows the stops were taken; the close and what follows show whether price meant it.
- Premium, Discount and Equilibrium: Split the dealing range at its 50%: longs in discount, shorts in premium.
- Optimal Trade Entry (OTE): The 62-79% band of a clean leg: where to look on a pullback, with a reason inside it.
- Fair Value Gaps (FVG): Three candles that don't overlap: mark it wick to wick and judge it by the closes.
- Inversion Fair Value Gaps (IFVG): A gap a candle body closed through: it can flip sides, and where it forms decides if it matters.
- Order Blocks: The last opposite-close candles before the shift: frame them with bodies and only count them after a sweep, a shift and displacement.
- Breaker Blocks: An order block that failed after a sweep: frame the candles of the broken swing with bodies and judge them by the closes.
- Mitigation Blocks: A breaker's shape without the sweep: the second swing stops short, price breaks the swing between, and the candles in that second swing become the block.
- Propulsion Blocks: An order block built on an order block: a candle dips into a fresh order block, holds its middle, closes back out, and a close beyond its open makes its body the block.
- Change in State of Delivery (CISD): A body close back through the open of the run that made the high or low: the first sign that the other side has taken over.
- Daily bias: Which side of yesterday's range today is more likely to reach, read from yesterday's candle, with yesterday's 50% as the line to respect.
- Intraday bias: The daily bias read on the four-hour candles: which side of the last candle's range the next one is more likely to reach.
- Power of three (AMD): Accumulation, manipulation and distribution: the range, the wick and the body of a daily candle, and how to check a manipulation.
- Standard deviation projections: Which leg to measure, the -1, -2, -2.5 and -4 marks, when they are void, and how often NQ actually reached them.
- Inducement: The small swing high or low in front of a zone, why price runs it on the way in, and whether it helps the zone hold.
- SMT Divergence: When NQ and ES disagree at the same level, what that one-sided sweep says, the confirmation to wait for, and how often it held.
- High vs Low Resistance Liquidity: How to read the path between price and a pool: a clean path left by a fast move, or a crowded path of defended highs, and why distance matters more.
- London Reversal Daily Profile: The ICT London reversal daily profile: London runs one side of the night and turns, New York continues. Rules, real NQ sessions and how often it held.
- New York Daily Profiles: Three ICT daily profiles where New York turns the day: the New York manipulation, the New York reversal and seek and destroy, with real NQ sessions and how often each showed up.
- Weekly Profiles: Classic Expansion and Midweek Reversal: Two ICT weekly profiles, the classic expansion and the midweek reversal: which day makes the weekly wick, three real NQ weeks and how often each showed up.
- Weekly Profiles: Consolidation Reversal, Intraweek Reversal, Thursday Counter and TGIF: Four ICT weekly profiles, the consolidation reversal, intraweek reversal, Thursday counter and TGIF, on four real NQ weeks and 731 weeks of data.
- Draw on Liquidity: Which high or low price is most likely to reach next, and two simple reads to pick the side.
- Liquidity: Where stop orders rest above highs and below lows, and how price runs from one pool to the next.
- All ICT Concepts Decoded lessons (the series hub)
- The ICT Concepts Decoded playlist on YouTube
Keep learning
- How prop firm drawdown works
- How to pass a prop firm evaluation
- Trading futures with a funded account? Futures prop firms ranked and side-by-side comparisons