ICT Decoded · Liquidity
What Is ICT Liquidity and How Do You Find It on a Chart?
By Steve H — reads every firm’s official rulebook, checks prices and codes daily, and maintains the Enigma Score · Methodology · Editorial policy · Last updated October 28, 2026
ICT concepts were created and are taught by Michael J. Huddleston, The Inner Circle Trader (X · YouTube). This lesson is FundedEnigma’s own summary, not affiliated with or endorsed by ICT.
In short: ICT liquidity (also called liquidity concepts, or buyside and sellside liquidity) is the pool of stop orders resting just above old highs and below old lows. Buy stops above a high are buyside liquidity (BSL). Sell stops below a low are sellside liquidity (SSL). Price is often drawn to these pools, runs through them, and many real moves start there.
How to Find Liquidity Like a Pro (ICT Buyside & Sellside Explained) · 7:33 · published October 28, 2026 · part of the ICT Concepts Decoded playlist
Watch the video
The full video is embedded above this article: How to Find Liquidity Like a Pro (ICT Buyside & Sellside Explained). This page is the written version, with every chart and example walked through step by step. Jump to any part of the video:
Key facts: the liquidity levels to know
| Term | What it is | Where it sits |
|---|---|---|
| Buyside liquidity (BSL) | Buy stops from traders who are short | Just above a swing high |
| Sellside liquidity (SSL) | Sell stops from traders who are long | Just below a swing low |
| Old high / old low | A single swing point that stands out on its own | Above an old high (BSL) or below an old low (SSL) |
| Equal highs / equal lows | Two or more swing points at nearly the same price; close is enough | Just above the cluster of highs or below the cluster of lows |
| PWH / PWL | Previous week's high and low | At last week's extremes |
| PDH / PDL | Previous day's high and low | At the prior trading day's extremes |
| Asia high / low | High and low of the Asia session, 20:00-00:00 New York time | At the edges of the Asia box |
| London high / low | High and low of the London session, 02:00-05:00 New York time | At the edges of the London box |
Last verified 2026-10-28. All charts below are real historical CME NQ futures data, shown in New York time.
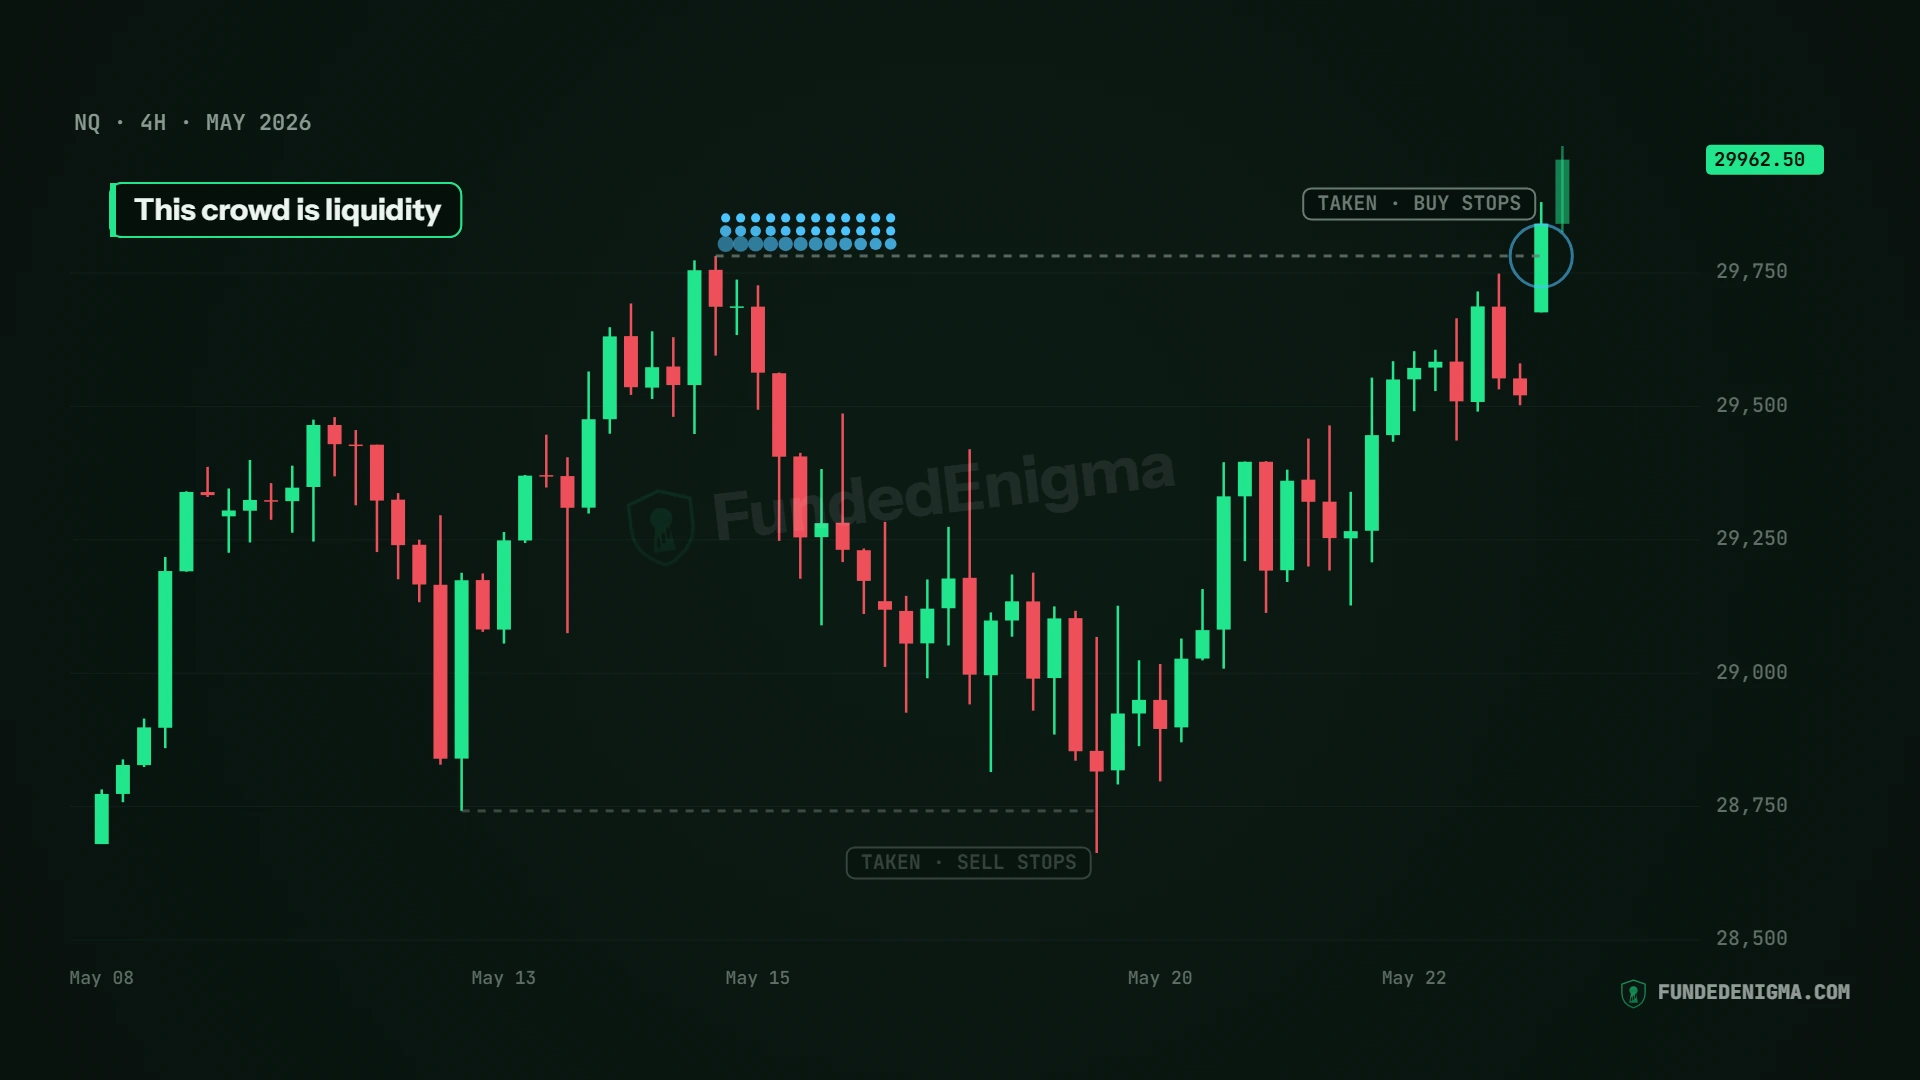
Here is the idea on one chart. This is the four-hour Nasdaq futures chart from May 2026.
- On May 12, price prints a clear swing low. Traders who bought put their stops under it.
- Two days later, on May 14, price prints a clear swing high. Traders who sold put their stops above it. The dots on the chart show that crowd of buy stops.
- Price falls first and, on May 19, trades through the old low. Those sell stops are filled: the label reads "Taken, sell stops."
- Then price climbs back through the week of May 18-22 and, when trading reopens after that weekend, runs through the old high. Those buy stops are filled too, and the last candle shown closes at 29,962.50.
Both ends of the range got taken. That is what liquidity does: it pulls price toward it.
What is a swing point in ICT trading?
A swing point is three candles where the middle one sticks out. Swing points are the building block of liquidity, because they show where stops are parked.
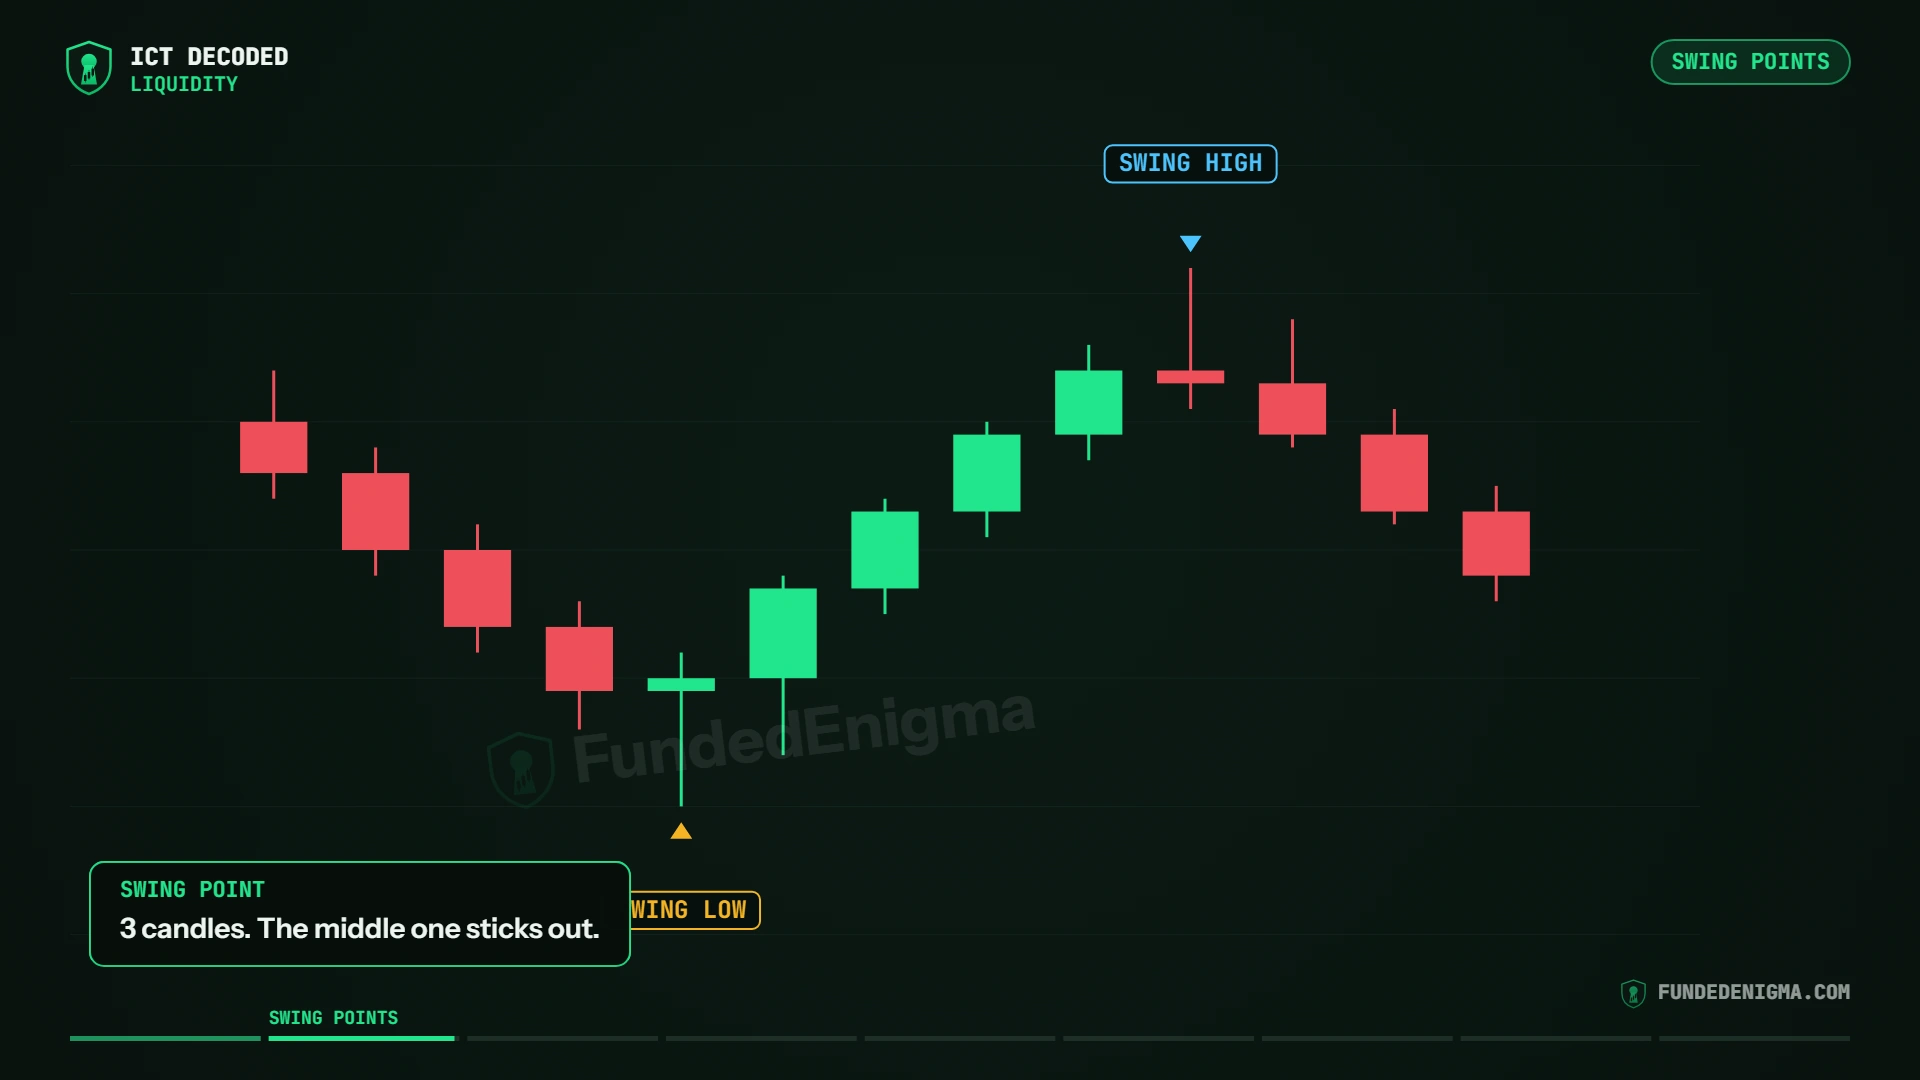
How to read this chart:
- Start at the bottom. Look at three candles side by side.
- If the middle candle has the lowest low, with a higher low on its left and a higher low on its right, it is a swing low. The yellow arrow marks it.
- Now flip it over. If the middle candle holds the highest high, with a lower high on each side, it is a swing high. The blue arrow marks it.
- That is the whole rule. No indicator required.
Where do stop losses hide on a chart?
Stops hide just beyond swing points: below swing lows and above swing highs. These are the obvious places, and almost everyone picks them.
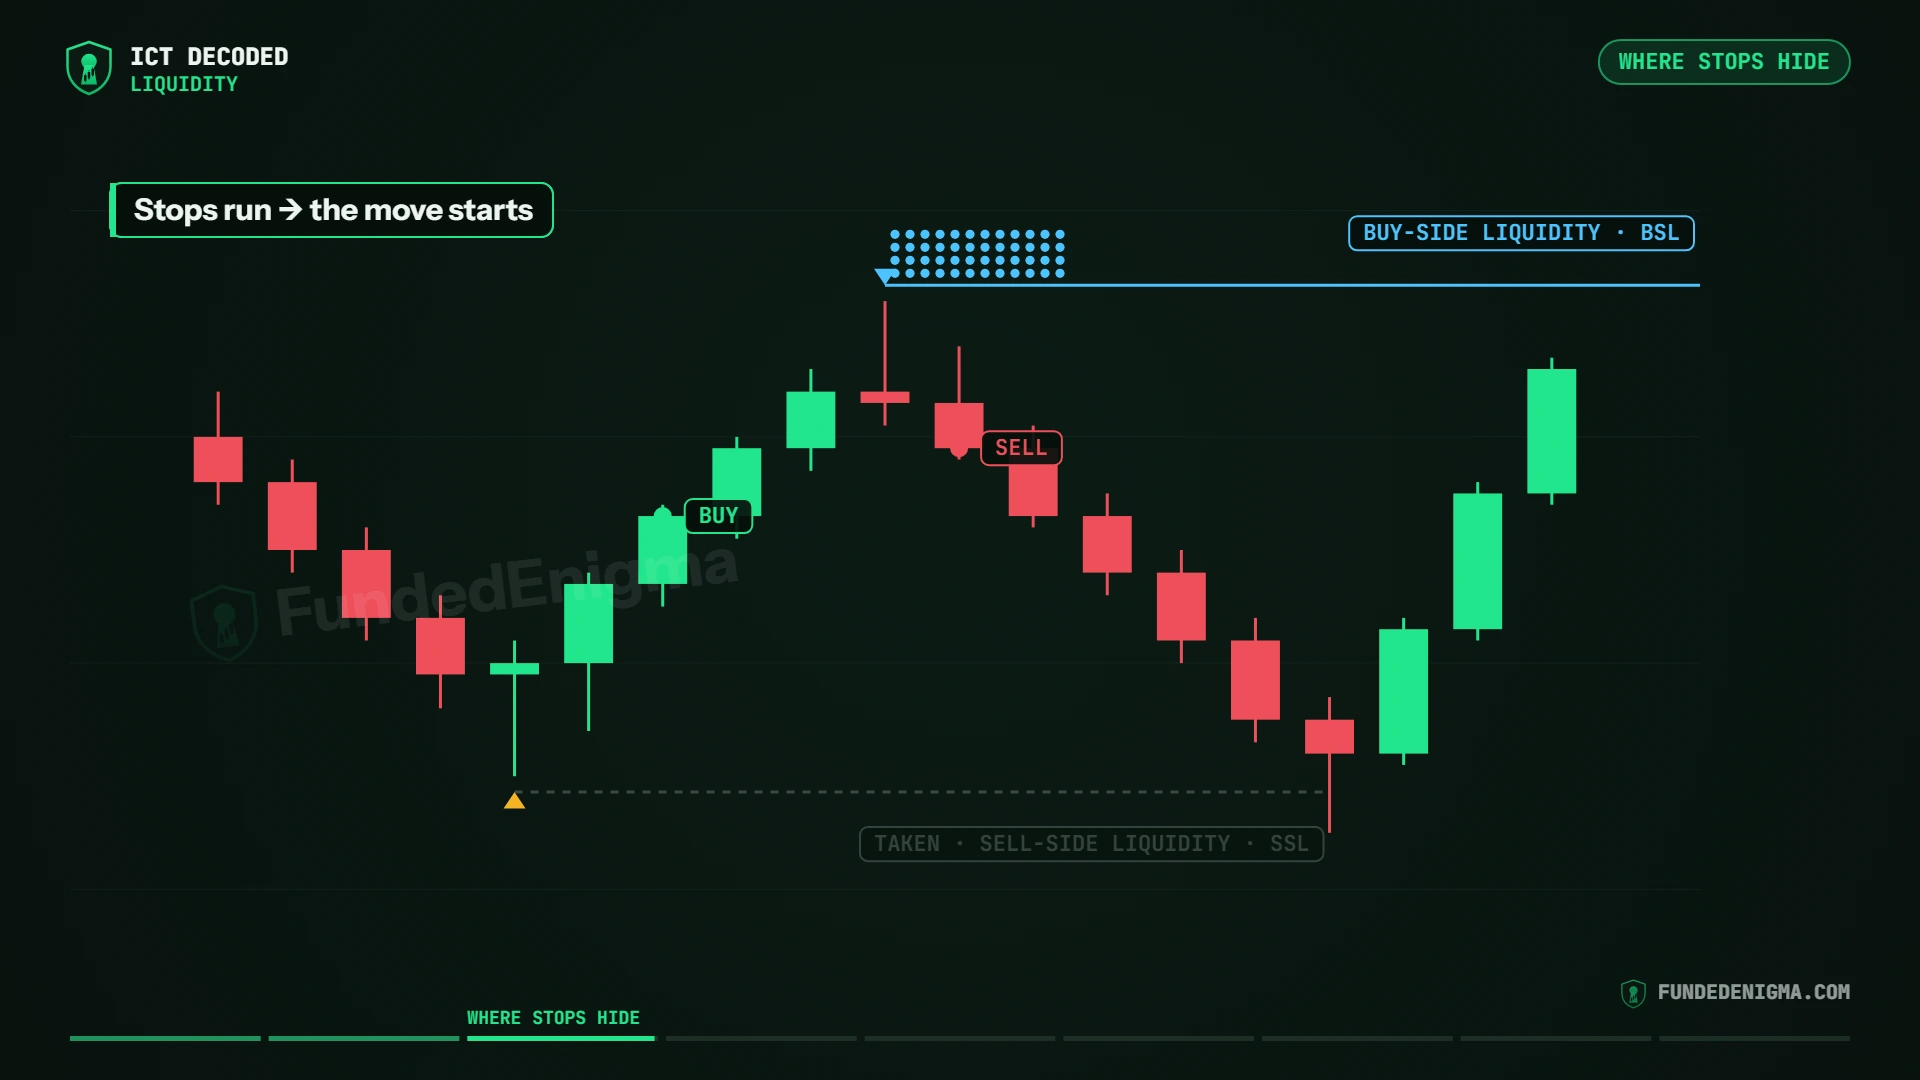
Walk through it with two traders:
- The buyer. A trader buys as price rallies off the swing low (the "BUY" tag). Their stop goes just under that swing low.
- A stop on a long is a sell order. So under the swing low, sell stops stack up. That pool is sellside liquidity (SSL), the dashed line.
- The seller. Another trader sells after the swing high (the "SELL" tag). Their stop goes just above that high.
- A stop on a short is a buy order. So above the swing high, buy stops stack up. That pool is buyside liquidity (BSL), the blue line with the dots.
- Now watch what price does. It falls through the swing low and takes the sell-side liquidity (the "TAKEN" label). Then it turns and rallies hard toward the buy-side above.
The headline on the chart says it in four words: stops run, the move starts.
What is buyside liquidity?
Buyside liquidity (BSL) is the pool of buy stops resting just above a swing high. Those stops belong to traders who are short. When price trades up through the high, they fire as buy orders.
What is sellside liquidity?
Sellside liquidity (SSL) is the pool of sell stops resting just below a swing low. Those stops belong to traders who are long. When price trades down through the low, they fire as sell orders.
Why does price go to liquidity?
In ICT's model, price goes to liquidity because large players need a lot of orders on the other side to fill their size. A pool of stops is exactly that.
A big buyer cannot buy size where nobody is selling. When price trades through a swing low, the sell stops under it fire as market orders, and the big buyer has someone to buy from. At a high it works in reverse: the buy stops give a big seller the buyers they need.
What is a liquidity sweep?
A liquidity sweep is when price trades through a swing high or low and fills the stops resting there. Many traders also call it a liquidity grab or a stop run. Once a level is swept it is spent, and price often reverses or moves on to the next pool.
How do you find and identify liquidity on a chart?
Mark each obvious swing high as buyside liquidity and each obvious swing low as sellside liquidity, then watch which ones price takes. Once a level is taken, drop it and look for the next one.
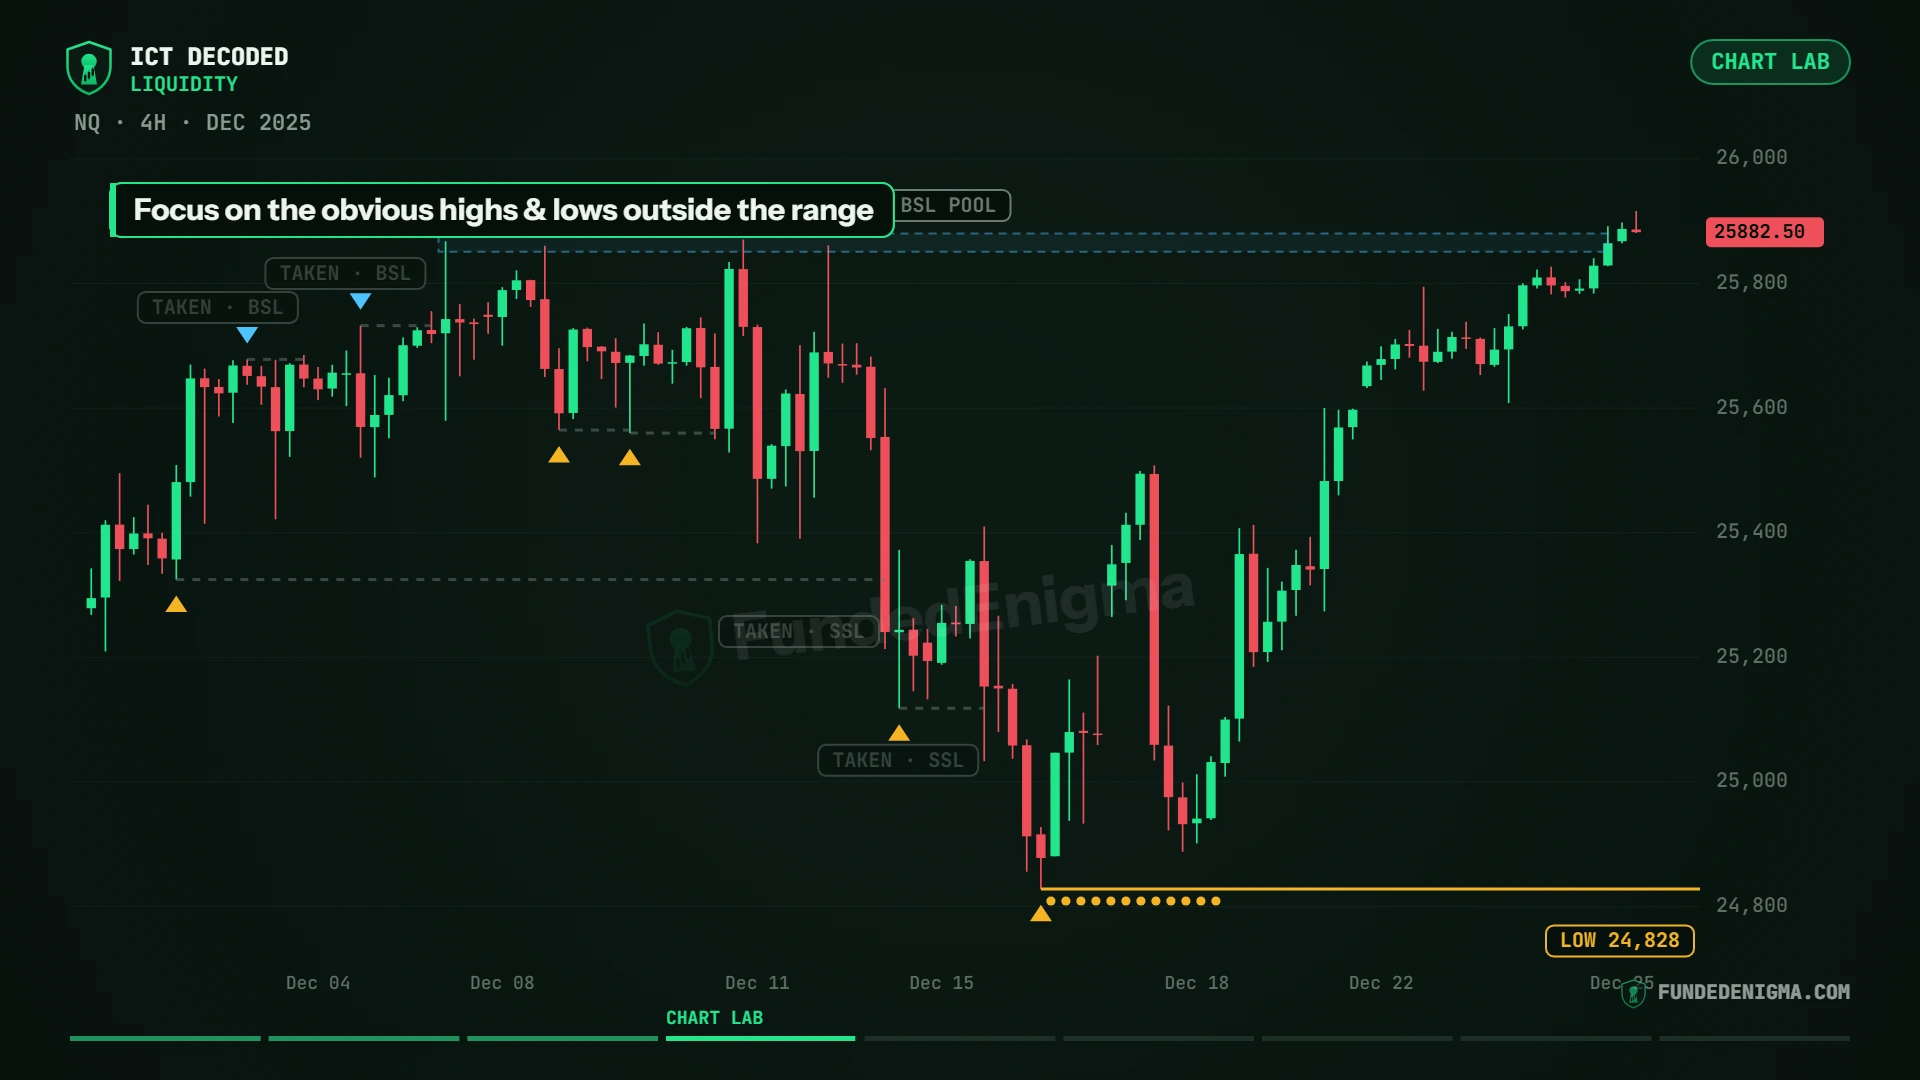
This is the chart lab: the four-hour chart of Nasdaq futures in December 2025. Here is the replay, step by step.
- First swing low. It has a higher low on both sides. That is sellside liquidity, so we mark it (the yellow arrow at the far left, with a dashed line running right).
- Swing high above. Buyside liquidity. We mark it.
- Price runs it. Those buy stops just got filled, so the level is spent ("TAKEN, BSL"). We drop it and look for the next obvious high.
- The next high forms, and price runs that one too. That is the rhythm: mark it, watch it get taken, move on.
- A pause and a pullback. Two lows print almost at the same price (the two yellow arrows). Two piles of stops in the same spot.
- Price comes back and takes both of them in one push.
- Something bigger builds up top. Four highs over about a week, all within about ten points of each other. That is a big pool of buy stops, marked "BSL POOL."
- Price drops first. It runs one sellside low after another ("TAKEN, SSL") and prints a low at 24,828.
- Then it turns and climbs right back to those equal highs, and runs every one of them. The oldest of those highs (Dec 5) had sat there for more than two weeks. The last price shown is 25,882.50, above the whole pool.
Notice what we skipped: the tiny swings in the middle of the range. The stops that matter sit at the clear highs and lows on the edges of the range.
What is the difference between old highs and lows and equal highs and lows?
Equal highs or lows are two or more swing points at nearly the same price. An old high or low is a single swing point that stands out on its own. Both work as targets, but equal highs and lows tend to stack more stops.
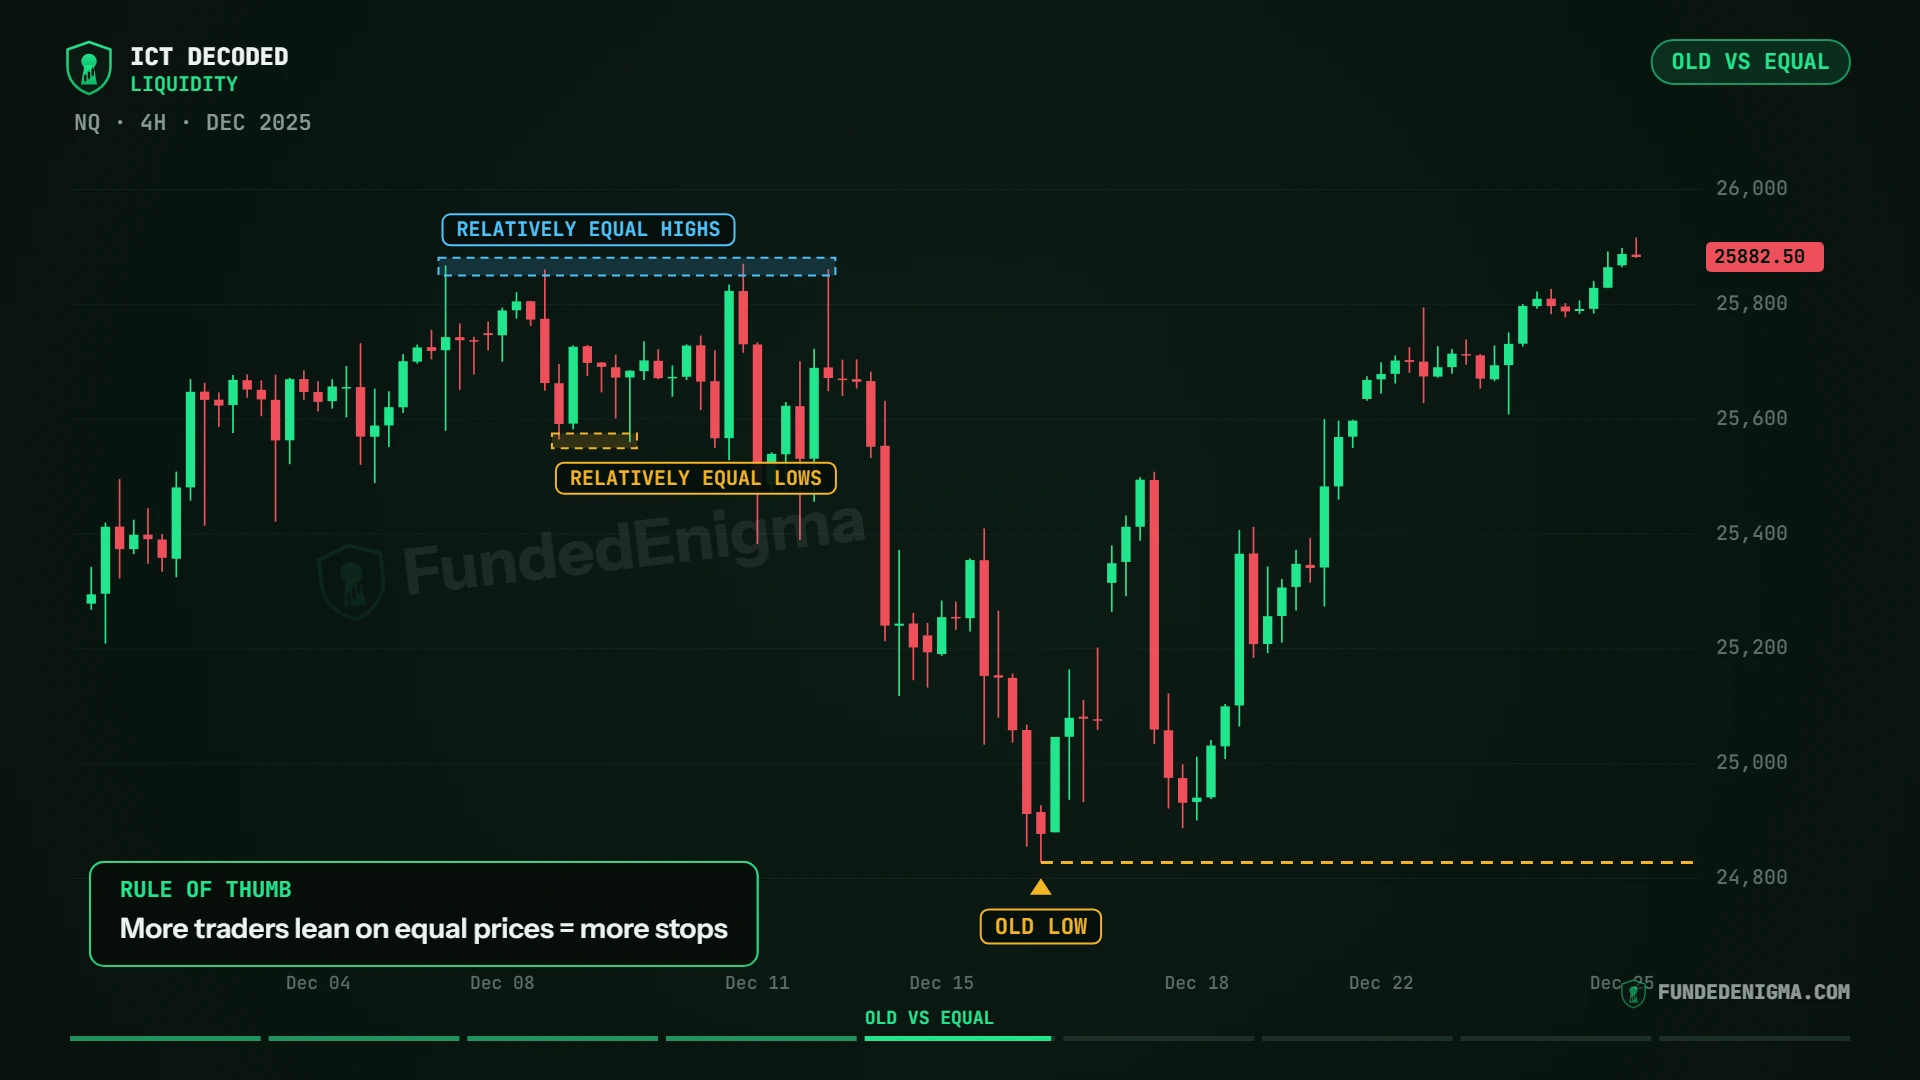
Same December 2025 chart, now labelled by type:
- Relatively equal highs (blue box at the top). The cluster of highs from the chart lab. They sit at nearly the same price. Equal does not have to be exact; close is enough.
- Relatively equal lows (yellow box under them). The two lows that printed almost at the same price during the pullback.
- Old low (yellow arrow near the bottom). The low at 24,828. Nothing came close to it, so it stands alone.
Why do equal levels matter more? More traders lean on the same price. A double top looks like "resistance" to many people, so many sellers put their stops just above it. That makes the pool bigger, which makes it a stronger draw.
How do you mark liquidity levels before every session?
Mark the previous week's high and low, the previous day's high and low, and the Asia and London session highs and lows. You do not have to trade every one, but you should always know where they are.
Level 1: previous week high and low (PWH / PWL)
Price often reaches for last week's high or low, and sometimes turns there. Either way, it is a level worth having on the chart.
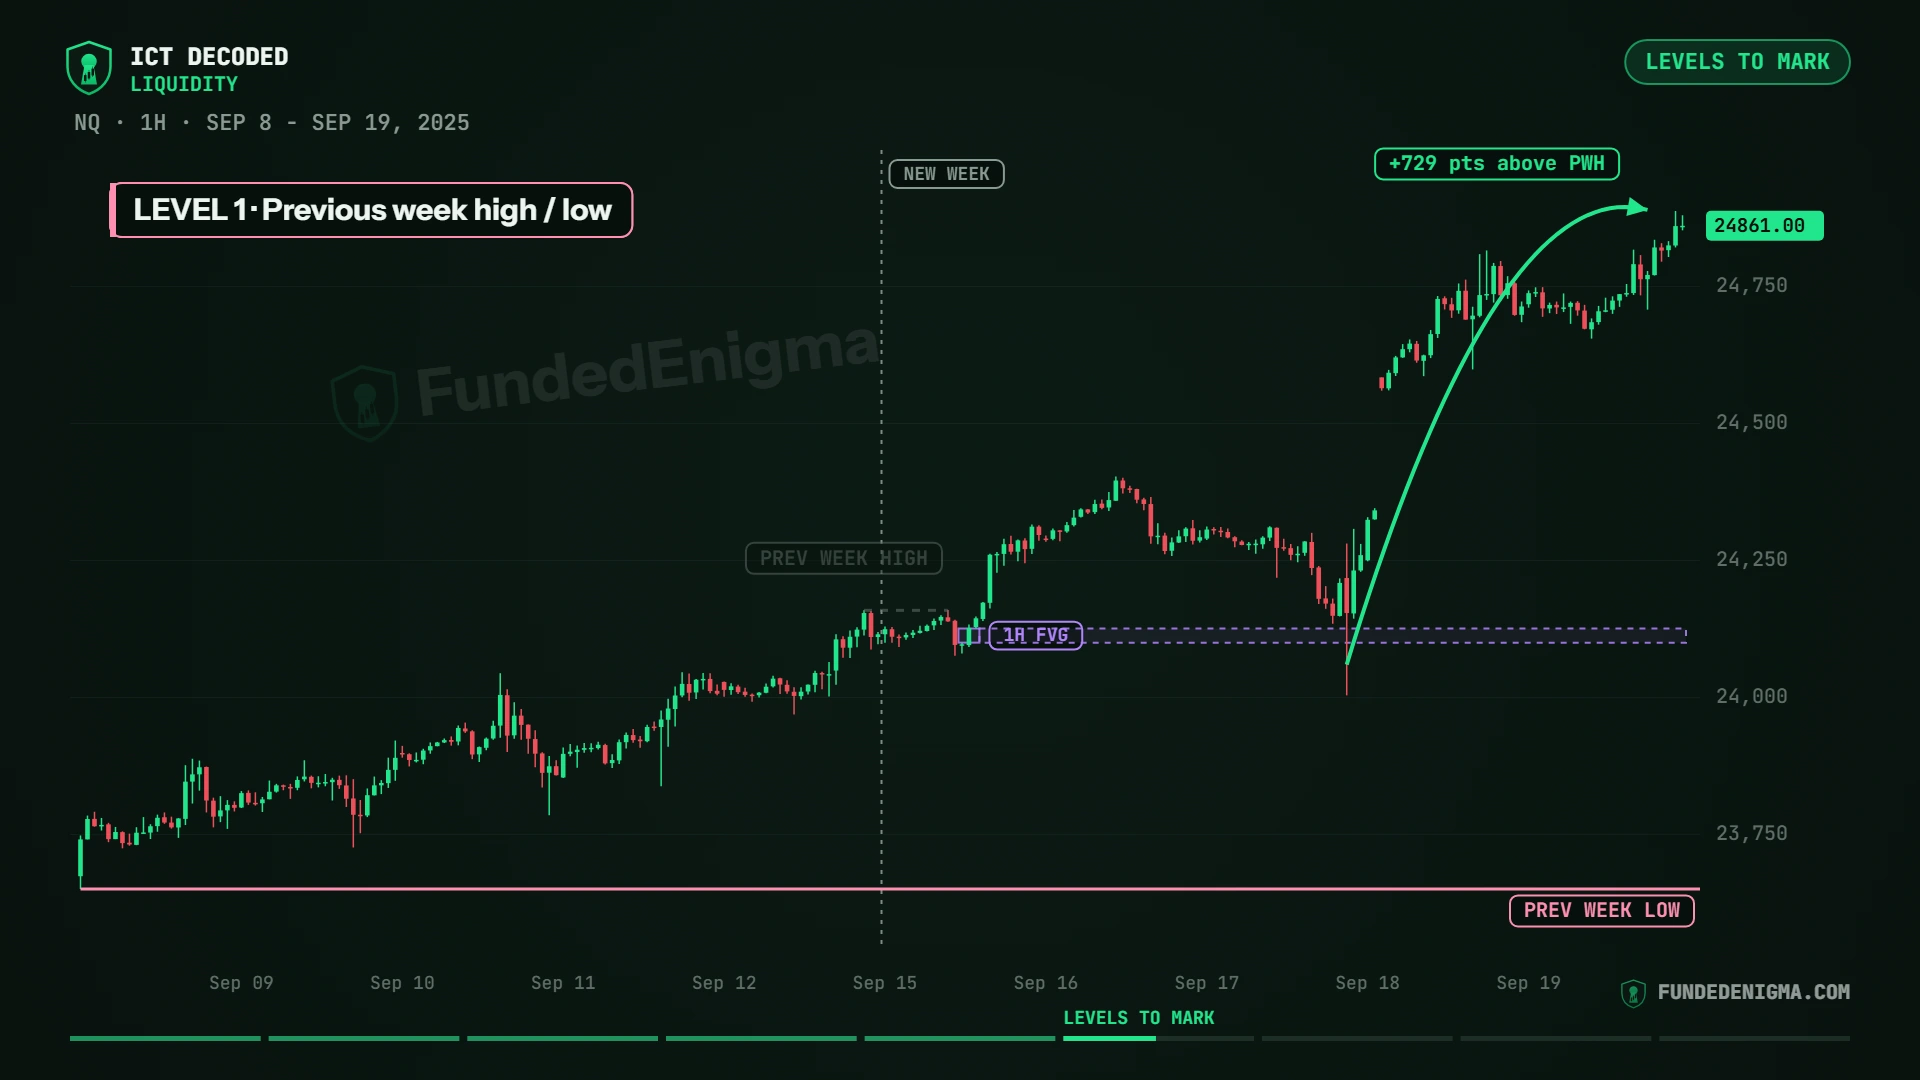
Walkthrough of the September 2025 example:
- The chart shows two weeks of NQ on the one-hour chart. The first week runs from Sep 8 to Sep 12. Its high is marked "PREV WEEK HIGH" and its low "PREV WEEK LOW."
- The dotted line marks the new week. On Monday, Sep 15, the new week trades straight through last week's high. The buy stops above it are taken.
- As price breaks that high, it leaves a one-hour fair value gap (FVG) behind, the purple box. A fair value gap is a fast move that leaves a price range barely traded.
- On Wednesday, price falls right back into that gap.
- From the gap, price expands higher. By Friday, Sep 19, price has traded as high as 729 points above the previous week's high (the chart label reads "+729 pts above PWH"), and the last price shown is 24,861.00. That is a historical price move on the chart, not a trading result.
The week's story: take the old high, come back to the gap, then go.
Level 2: previous day high and low (PDH / PDL)
They work like the weekly levels, just over a single day: price may reach for them, or turn from them.
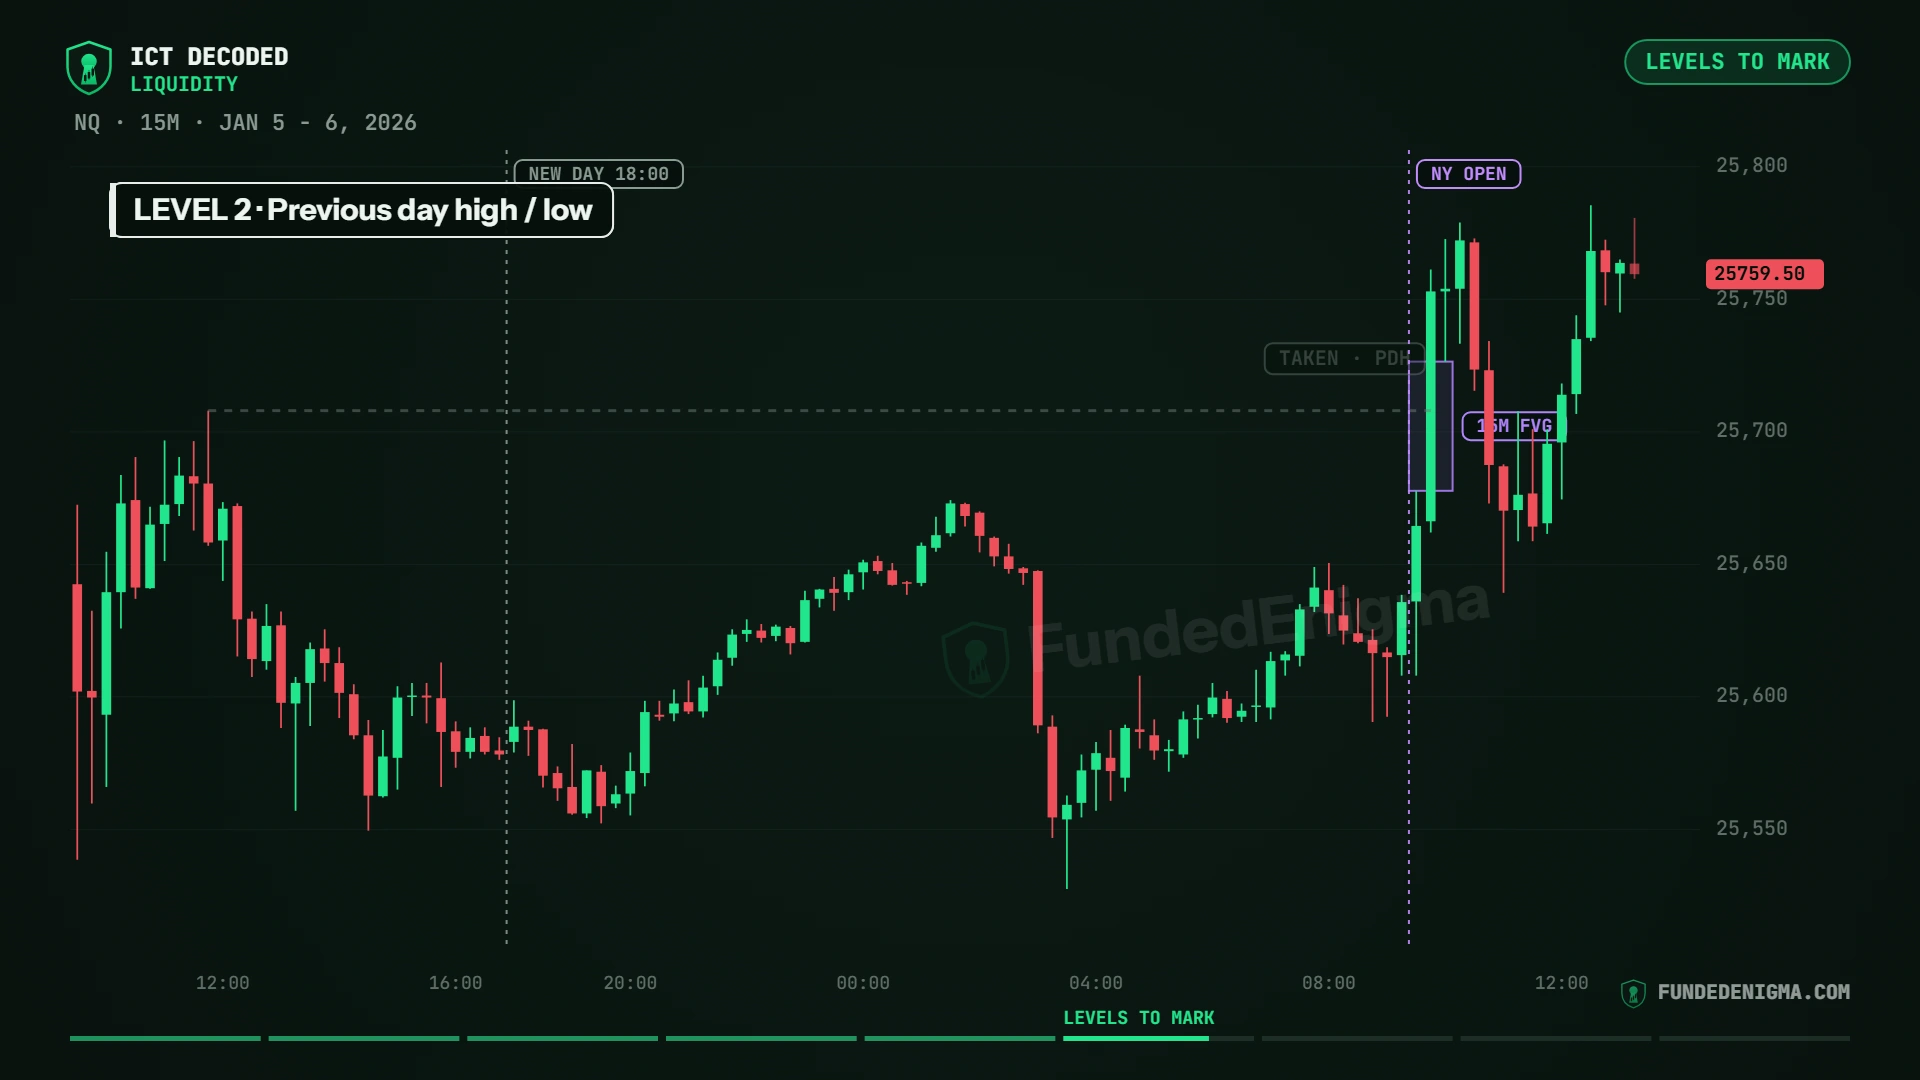
Walkthrough of the January 6, 2026 example:
- On the left is Jan 5. Its high is the dashed line running across the chart. That is the previous day's high for Jan 6.
- The dotted line marked "NEW DAY 18:00" is where the next futures trading day begins, 18:00 New York time.
- Overnight, price stays under yesterday's high. The pool of buy stops sits overhead.
- New York opens and goes straight for it. The previous day's high is run ("TAKEN, PDH").
- On the way through, price leaves a 15-minute fair value gap (the "15M FVG" box).
- Price pulls back into that gap, and then keeps going higher. The last price shown is 25,759.50.
Level 3: session highs and lows (Asia and London)
The Asia session runs from 20:00 to midnight (00:00) New York time. London runs from 02:00 to 05:00 New York time. Draw a box around each session and mark its high and low.
By the time New York opens, these boxes tell a story. Which pools have been taken? Which are still waiting? That is your narrative for the day. The next two examples show it working.
How do you trade a liquidity sweep?
Do not treat the sweep on its own as the signal; read what price does after it. On a typical day, price takes one pool, displaces away from it, retests the fair value gap it left, and then runs to the next untouched pool. Here are two real NQ days on the five-minute chart.
Example 1: NQ 5-minute, November 10, 2025
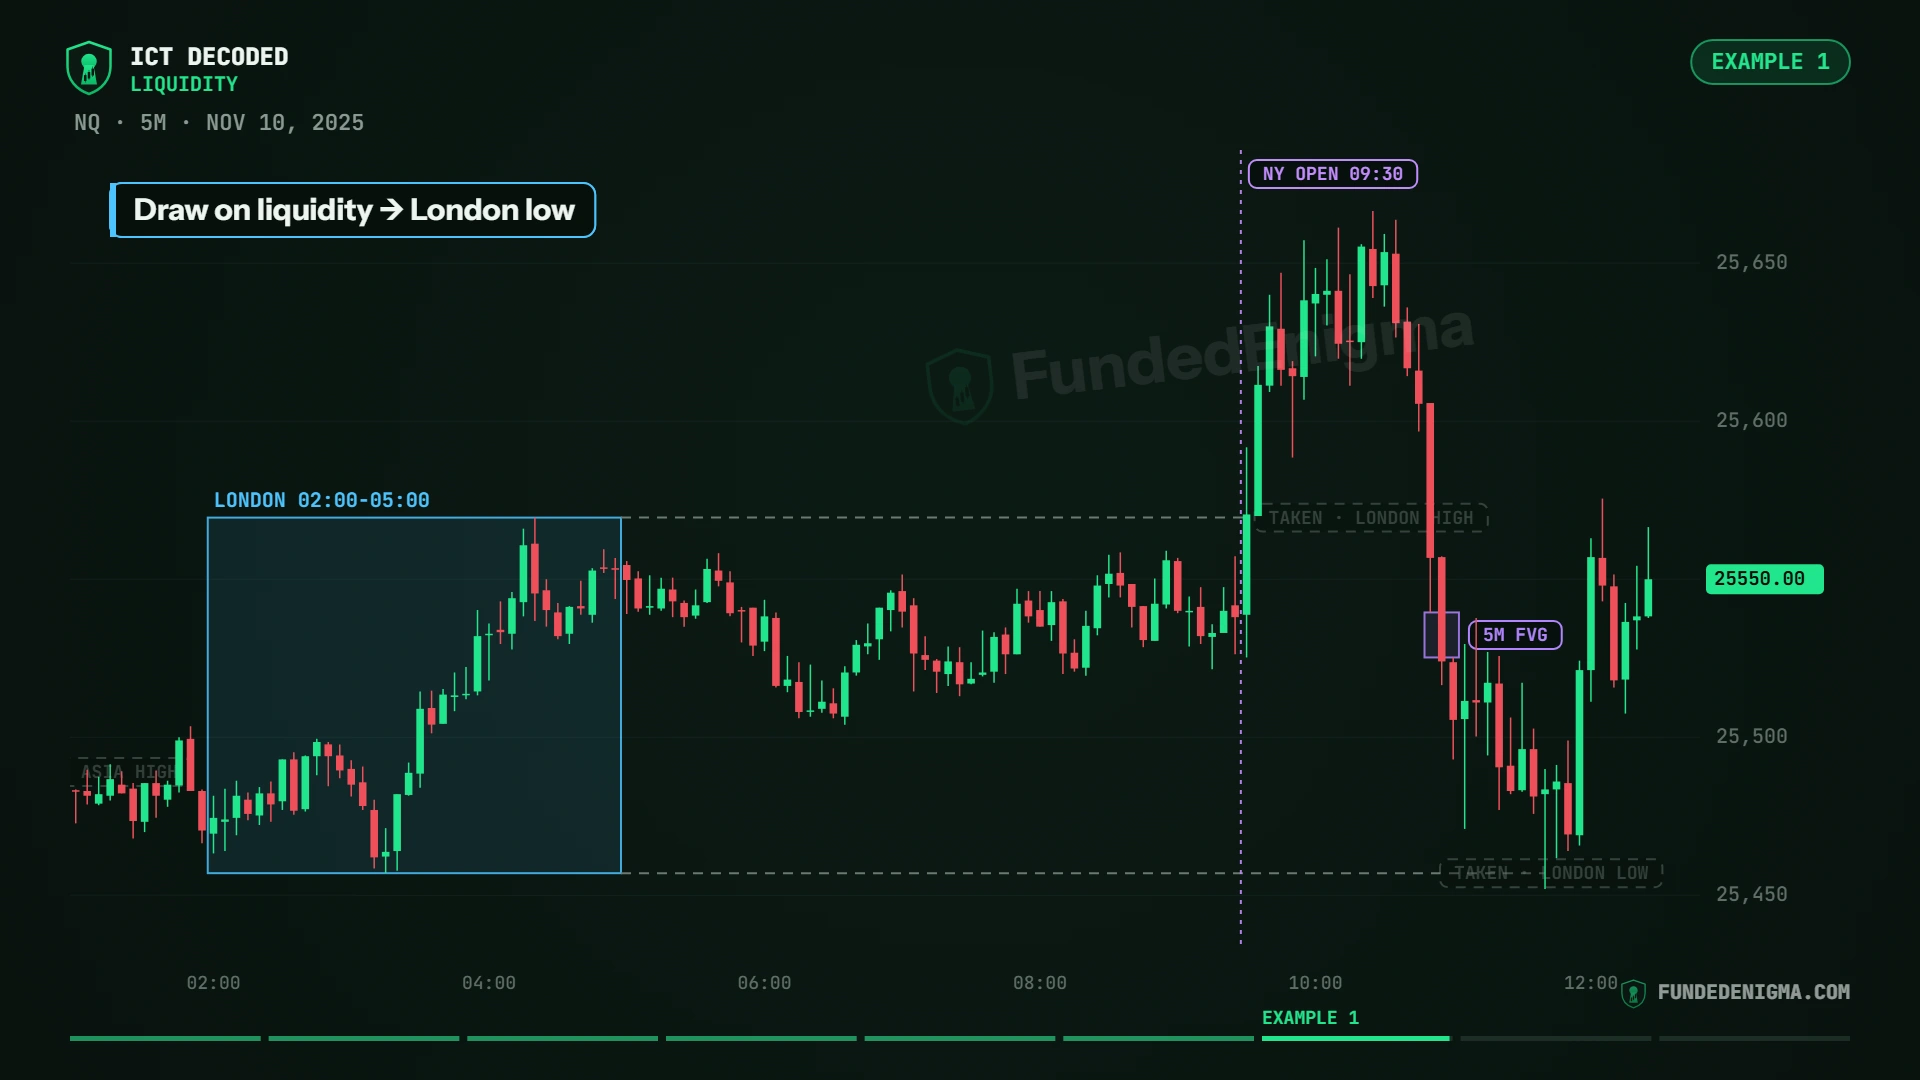
The setup before New York opens: just after midnight, before London even started, price traded above the Asia high (the faint label on the far left), so that pool is gone. Still waiting are the London high above and the London low below, the edges of the 02:00-05:00 box. Step by step:
- 09:30, New York opens and goes for the buyside first. The London high is taken in the opening minutes ("TAKEN, LONDON HIGH").
- Price keeps pushing for about an hour, but it cannot hold up there. The highest prices on this chart print in this stretch.
- Displacement. Strong candles drive straight down, back through the London high.
- The 5-minute fair value gap. That fast move leaves a gap (the "5M FVG" box). Price comes back up into it and gets rejected.
- Where is it going? To the liquidity still untouched below: the London low.
- About half an hour later, the London low is taken ("TAKEN, LONDON LOW"). The last price shown is 25,550.00.
The session levels framed that whole morning before New York even opened.
Example 2: NQ 5-minute, October 1, 2025
This time we add the previous day's high and low too.
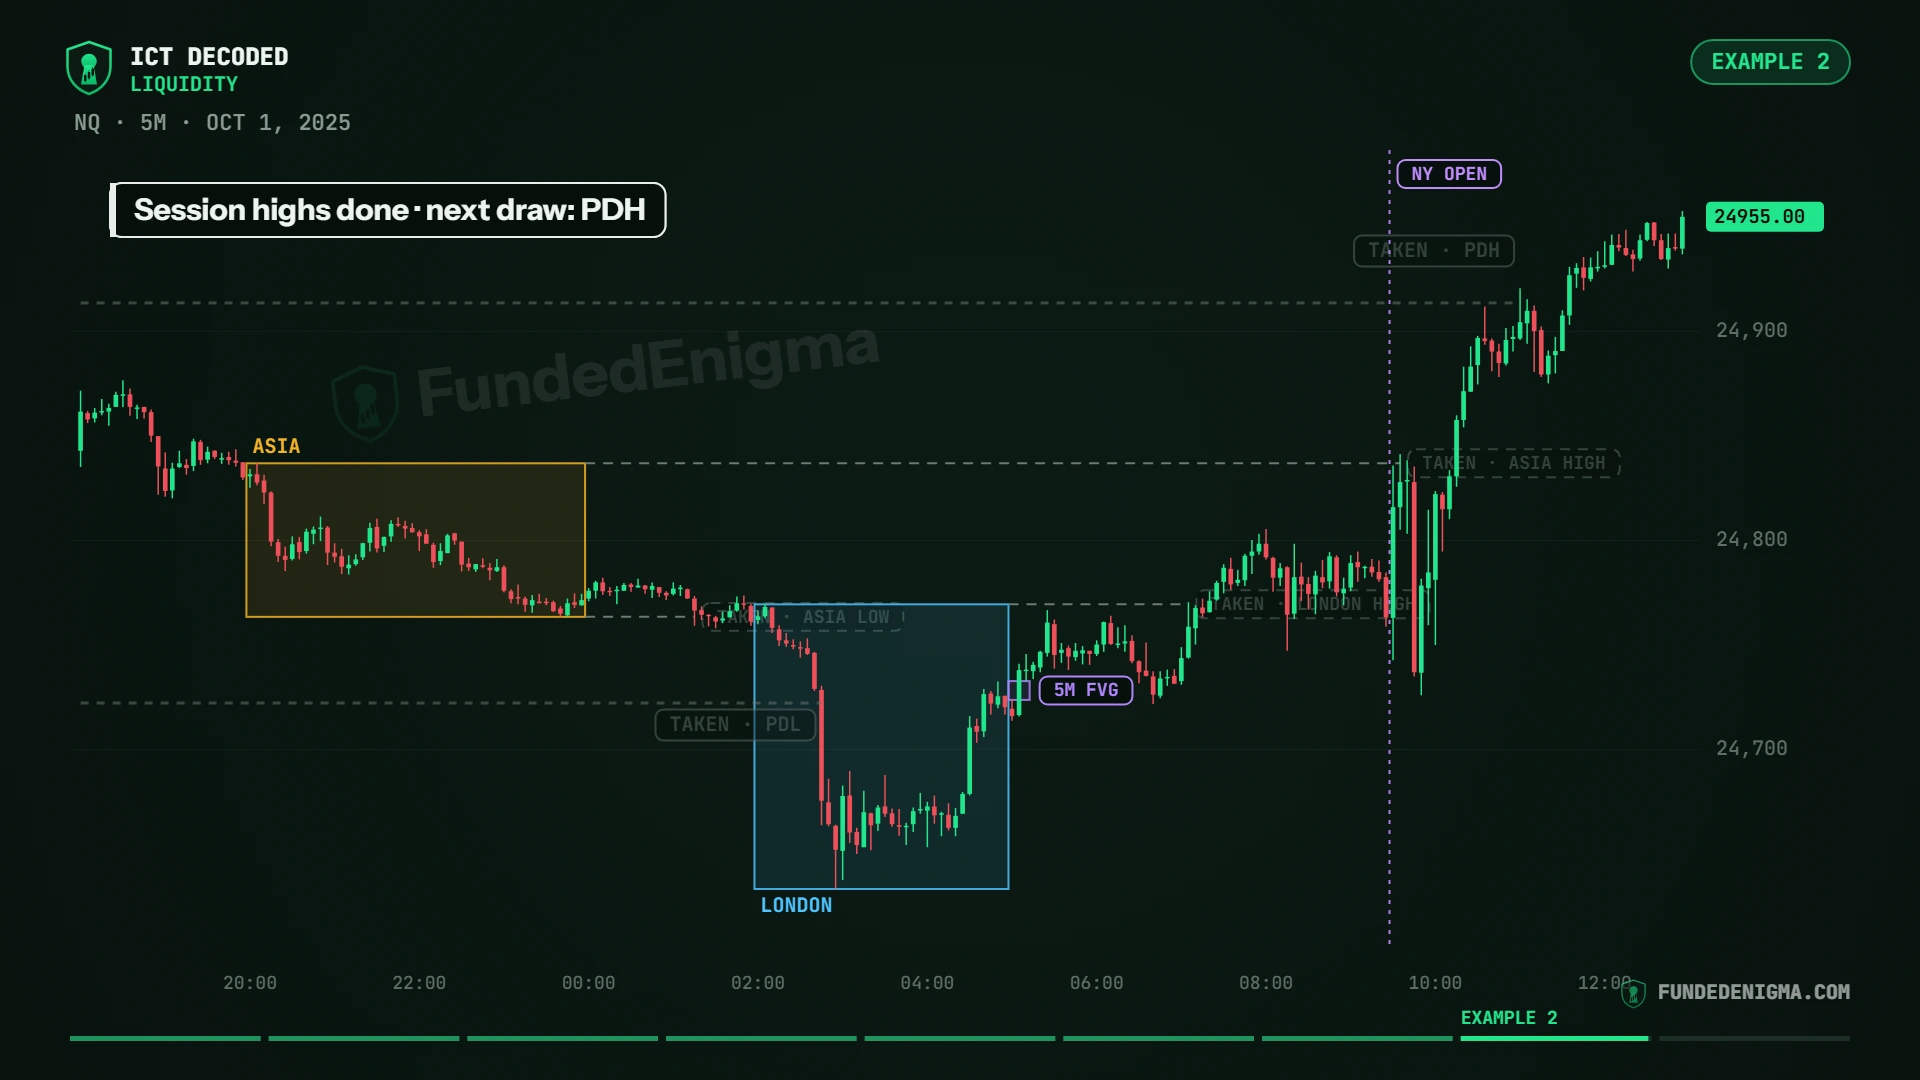
On the chart: the Asia box (yellow, 20:00-00:00), the London box (blue, 02:00-05:00), and the previous day's high and low as dashed lines at the top and bottom. Step by step:
- Just before London opens, price slips under the Asia low. During London it drops under yesterday's low as well. Both sellside pools are taken ("TAKEN, PDL").
- But look: there is no real follow-through below.
- Displacement up. A strong move higher leaves a 5-minute fair value gap (the "5M FVG" box).
- Price comes back, tags that gap, and turns up from it. Now the draw is above: first the London high, then the Asia high.
- The London high goes before New York. ("TAKEN, LONDON HIGH")
- The Asia high goes right at the New York open. ("TAKEN, ASIA HIGH")
- Both session highs are done. So what is left above? Yesterday's high.
- Price works its way up, displaces through the previous day's high, and keeps going into the afternoon ("TAKEN, PDH"). The last price shown is 24,955.00.
Read the whole day as a chain. Sellside taken first, then a shift, then buyside pools taken one by one, closest first, the daily level last.
How do you use liquidity in your own charting?
Use liquidity as a map, not as a trade signal. It tells you where price is likely to reach next; something else (like a displacement and a fair value gap) tells you when.
- Treat a taken level as spent. Once the stops are filled, that pool is gone. Drop it and look for the next obvious one, like we did in the chart lab.
- Watch what happens after a sweep. In both examples, the sweep alone was not the signal. In Example 1, the turn came with displacement down and a rejection at the gap. In Example 2, it came with no follow-through below, then displacement up and a gap that price turned up from.
- Practise on replay. Pick a past week, hide the right side of the chart, mark the pools, then play it forward. Pause before each move and ask where price will reach first. That is how the eye gets trained.
More concepts in the series are on the ICT Concepts Decoded hub. If you trade futures with a prop firm, you can look up a firm's rules on the challenges page or set two firms side by side on the compare page.
Frequently asked questions
What is liquidity in trading?
In ICT terms, liquidity is the resting orders, mostly stop losses, that sit above swing highs and below swing lows. Large players need those orders to fill their positions, so price is often drawn to them.
What is a liquidity pool?
A liquidity pool is a cluster of stop orders sitting at one price area: buy stops just above a swing high, or sell stops just below a swing low. Equal highs or lows build bigger pools, because more traders park their stops at the same price.
How do you find the draw on liquidity?
The draw on liquidity is the untouched pool price is most likely to reach next. Mark the weekly, daily and session highs and lows plus the obvious swing points, then cross out every pool already run before New York opens. What is left untouched is your likely draw.
Is liquidity the same in ICT and smart money concepts (SMC)?
The core idea is the same: buy stops rest above highs and sell stops rest below lows. Smart money concepts (SMC) is a name many traders use for ICT-style ideas. This page uses ICT's own terms, buyside and sellside liquidity.
Are equal highs stronger liquidity than an old high?
Equal highs and lows tend to stack more stops, because more traders lean on the same price. They do not have to match exactly: in the December 2025 NQ example, four highs within about ten points acted as one pool. Both types work as targets.
What happens after liquidity is taken?
The stops are filled, so that level is spent. Look for what price does next: in both NQ examples above, a displacement and a fair value gap pointed to the next untouched pool.
What timeframe should I use to find liquidity?
Use several. The examples on this page use the 4-hour chart for the big range, the 1-hour for weekly levels, the 15-minute for daily levels and the 5-minute for the session examples.
Sources
- Concept: buyside and sellside liquidity, old and equal highs and lows, and session levels come from the teachings of ICT (Inner Circle Trader), who originated these terms. The explanation, examples and charts on this page are our own.
- Data: every chart is real historical CME Nasdaq-100 E-mini (NQ) futures data, shown in New York time.
- Video: How to Find Liquidity Like a Pro (ICT Buyside & Sellside Explained), FundedEnigma.
Last verified: 2026-10-28. Written by Steve H.
Disclaimer: This page is for education only and is not financial advice. Trading futures involves substantial risk of loss. Past price behaviour does not guarantee future results.
Related ICT concepts
Keep learning
- How prop firm drawdown works
- How to pass a prop firm evaluation
- Trading futures with a funded account? Futures prop firms ranked and side-by-side comparisons